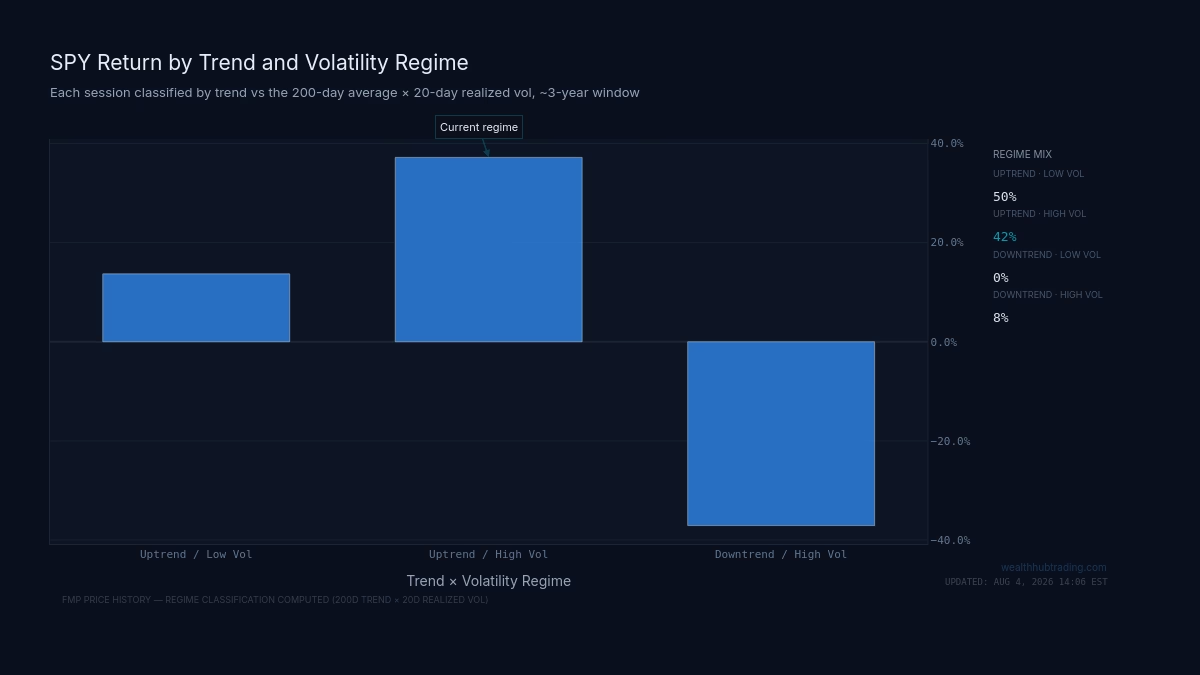
Consider two numbers that describe the same fifteen years but seem to belong to different markets. From 2011 to 2026, U.S. equities returned 12.09% annualized in real total return terms, and of that, dividends contributed a mere 1.76%. Across 145 years of rolling fifteen-year blocks, that dividend contribution sits at the first percentile. It is, quite literally, the least income-driven market of the modern record. And yet this same market, when it falls, panics with a violence its own recent ancestors would not recognize: a large down day now triggers roughly four times the chaos it did in the 1985–2000 era.
These are not two unrelated curiosities. They are the front and back of the same coin, and the coin was minted by a structural change in who owns stocks and why.
The pattern: when the buyer stops caring about the coupon
Begin with the dividend collapse, because it is the quieter of the two anomalies and the more revealing. For most of market history, the dividend was the point. An investor in 1955 or 1975 bought a share for the stream of cash it threw off, and the price was a claim on that stream. When Robert Shiller and later John Bogle decomposed long-run returns, dividends did most of the heavy lifting — often more than half the total, compounding quietly across decades.
The 2011–2026 window inverts that logic almost completely. Capital appreciation did nearly all the work. The market rewarded ownership of the asset itself, not the cash it distributed. There are proximate explanations everyone reaches for first: buybacks displaced dividends as the preferred return-of-capital channel after the 2003 tax changes and the post-crisis balance-sheet repair; the index leadership migrated to technology firms that retain rather than distribute; low rates pushed valuations toward the long-duration, cash-light end of the spectrum.
All true. But underneath them sits a deeper shift. The marginal buyer of equities stopped being someone who valued the coupon and became someone who valued the price path. Passive vehicles buy the index because it is the index, indifferent to yield. Volatility-targeting funds buy when realized volatility is low and sell when it is high, indifferent to fundamentals entirely. Multi-strategy pod shops trade the relationships between prices, not the streams beneath them. When the dominant holder of an asset cares about the second moment of returns rather than the first moment of cash flows, the dividend stops being the reason to own the thing. It becomes a rounding error, which is precisely what the first-percentile reading tells us it became.
Why the same market flinches harder
Now the volatility number, which comes from an old and careful piece of work. In 1993, Lawrence Glosten, Ravi Jagannathan and David Runkle published a model in the Journal of Finance that has carried their initials ever since. The GJR framework asked a simple question with a precise answer: how does the market's nervousness respond to good news versus bad news? They gave nervousness four parameters. Omega is the resting level, where volatility settles when nothing is happening. Beta is memory, how much of yesterday's fear carries into today. Alpha is the flinch, how hard volatility jumps on a large move. And gamma is the asymmetry, the extra fear that attaches specifically to losses rather than gains.
The insight that made the model durable was gamma. Markets do not respond symmetrically. A 3% down day frightens participants far more than a 3% up day soothes them, and gamma measures exactly that excess. Fischer Black had noticed the leverage-driven version of this asymmetry years earlier; GJR gave it a formula you could estimate.
Run that formula across eras and the present looks strange. Relative to 1985–2000, a big down day in today's market triggers about four times as much chaos — the flinch, the alpha-plus-gamma response, has multiplied. But two other things changed alongside it. The market has less next-day memory: beta fell, so the fear does not persist the way it once did. And the residual fear dissipates roughly twice as fast. The modern volatility regime is sharper and shorter. It spikes harder and forgets faster.
This is the signature of a market whose marginal participant is mechanical rather than fundamental. When volatility-targeting strategies and pod-shop risk desks all measure realized volatility off the same recent window and all cut exposure when it crosses the same thresholds, a down day does not merely frighten people. It triggers a wave of coordinated, formulaic selling that manufactures more volatility, which triggers more selling. That is the four-times flinch. But because the selling is a mechanical response to a number rather than a considered revision of value, it exhausts itself quickly once the risk models are satisfied. That is the faster decay and the shorter memory. The 1987 crash took years to work out of the collective psyche; the 2018 volmageddon, the March 2020 gap, the 2024 August unwind — each was violent and each was substantially resolved within weeks.
The structural cousins: 1987, 1998, 2018
The pattern of mechanical selling amplifying a shock is not new, only more pervasive. It is worth walking through three instances, because each shows the same mechanism operating at a different scale of adoption.
In October 1987, portfolio insurance was the culprit. The strategy, marketed heavily in the mid-1980s, promised downside protection by selling index futures automatically as prices fell — a formulaic response to a price level, mathematically elegant in isolation and catastrophic in aggregate. On October 19, the automatic selling met a market with no offsetting buyers, and the Dow fell 22.6% in a single session. The Brady Commission afterward identified the feedback loop precisely: a mechanical seller, responding to price rather than value, amplifying the move it was designed to hedge against.
In the autumn of 1998, the mechanism wore a different costume. Long-Term Capital Management held convergence trades justified by historical correlations, and when Russia defaulted in August, every holder of similar positions moved to reduce risk at once. The correlations the positions depended on converged toward one, exactly as they were assumed not to. The selling was not driven by a price-following formula this time but by risk-management discipline — value-at-risk limits breached simultaneously across desks — and the effect was the same: coordinated derisking that fed on itself.
In February 2018, the costume was volatility itself. A cluster of products that were short volatility — that profited when the VIX stayed low and lost when it spiked — had grown large enough to matter. When volatility rose, these products had to buy volatility to cover, which pushed volatility higher, which forced more covering. The VIX doubled in a day. XIV, the largest of the inverse-volatility notes, lost nearly all its value overnight and was liquidated. The mechanical seller was now literally a volatility-response function.
Trace the line through these three: portfolio insurance responded to price, LTCM's counterparties to risk limits, the 2018 complex to volatility directly. Each cycle, the trigger moved closer to volatility itself, and each cycle, the responding capital grew as a share of the market. By 2011–2026, the volatility-response function is not a product bolted onto the market. It is the market's dominant marginal participant.
What the two anomalies tell us together
Here is where the dividend collapse and the volatility flinch become one story. A market dominated by holders who care about the price path rather than the cash stream will, mechanically, pay almost nothing in dividends — because its marginal buyer does not price the coupon. And that same market will flinch four times harder on a down day and forget twice as fast — because its marginal seller is a formula responding to realized volatility, not a person revising a view of value.
The first-percentile dividend reading and the four-times alpha are the same structural fact observed through two different instruments. The buyer of the index does not want the coupon; the risk model of the pod shop does not tolerate the drawdown. Both are indifferent to fundamentals. One indifference shows up in the income statement of returns, the other in their second moment.
We can note the regime context without leaning on it: the 10-year yield sat at 4.75% at the end of July 2026, the 2s10s spread modestly positive at +0.47%, inflation no longer the acute problem it had been. This is not a market being forced into equities by zero rates, which makes the persistence of the pattern more telling. The structure has outlived the low-rate environment that helped create it.
The lesson is not that a crash is imminent, and it is not that mechanical investing is doomed. It is narrower and more durable than either. When the marginal participant in a market responds to volatility rather than value, the market inherits that participant's reflexes: it stops paying you to wait, and it converts every genuine shock into a sharp, self-amplifying, fast-decaying spasm. The dividend that vanished and the flinch that quadrupled are not two problems to solve. They are one regime to understand — and the sequence that produced it, from 1987's portfolio insurance to today's volatility targeting, is the part that repeats.