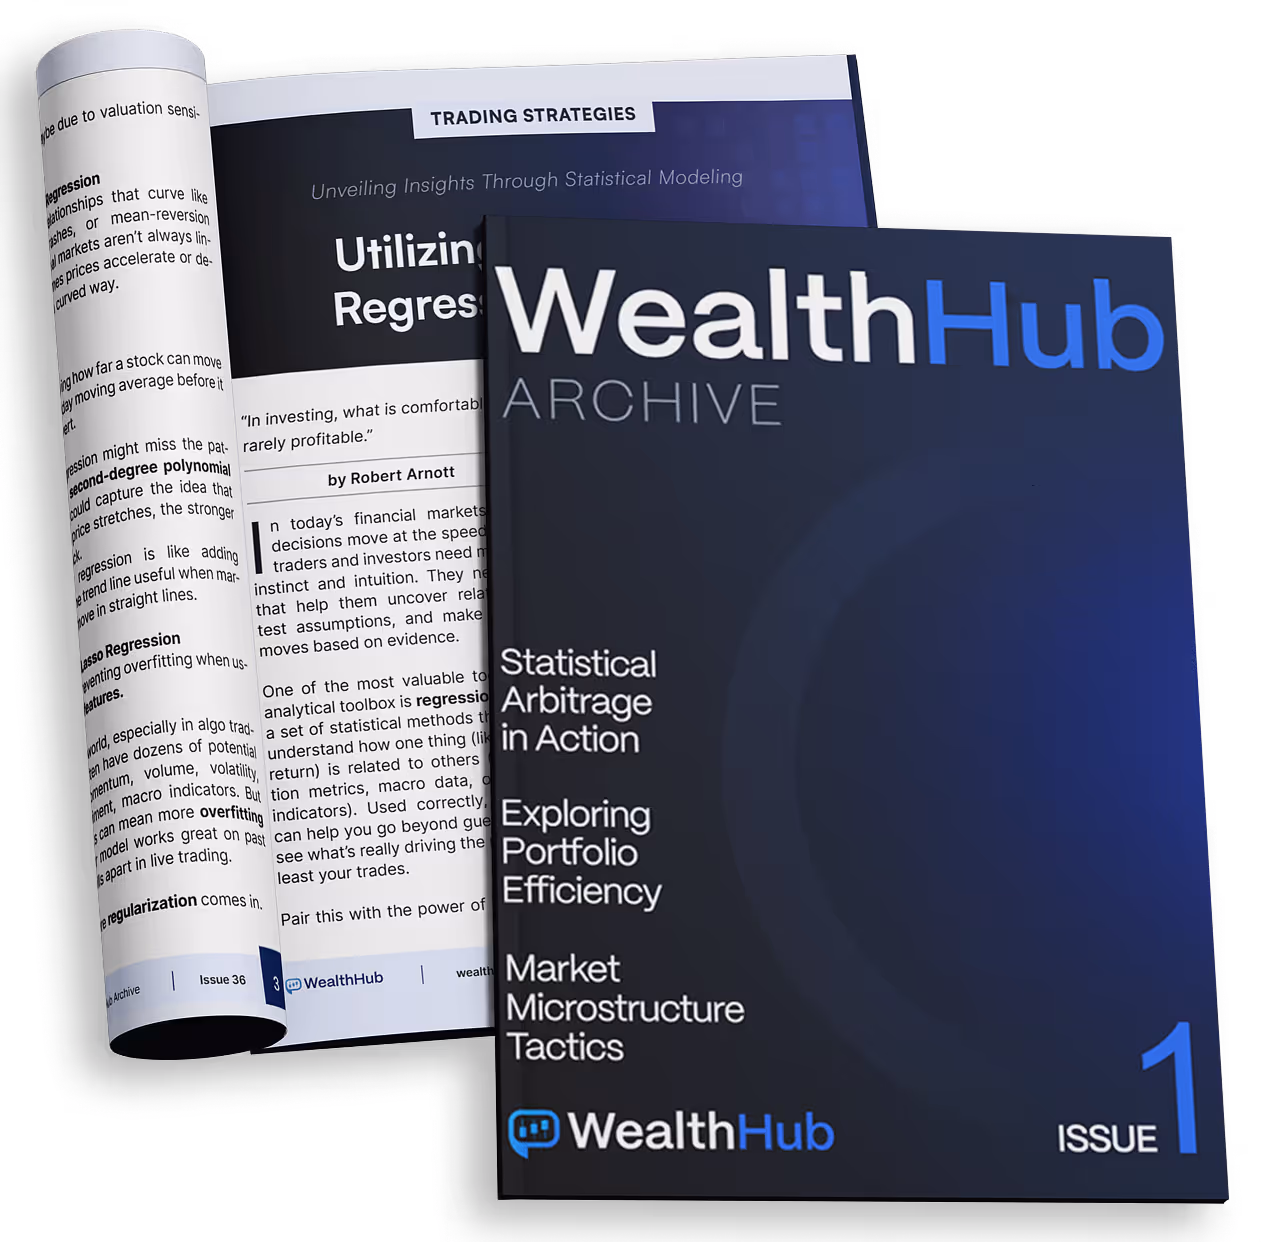
Skip to Content
Enter
Skip to Menu
Enter
Skip to Footer
Enter

Wealth Hub Archive
36 Issues. One Vault. Lifetime Access.

Unlock the complete Wealth Hub Archive - 36 issues packed with trading strategies, research, and real-world insights.

White document icon with a rising chart line on a blue circular background.
Proven strategies with code
Magnifying glass icon symbolizing search on a blue circular button.
Backtested setups across markets
White outline of an open book inside a blue circular background.
500+ pages of actionable insights
Magazine titled WealthHub Archive Issue 1 with topics including Statistical Arbitrage in Action, Exploring Portfolio Efficiency, and Market Microstructure Tactics.

empower

What You’ll Unlock

White brain icon on a blue circular background.

Expert Trading Insights

Lessons, patterns, and market wisdom distilled from real experience.

Blue circular icon with a white shield and checkmark symbol representing security or protection.

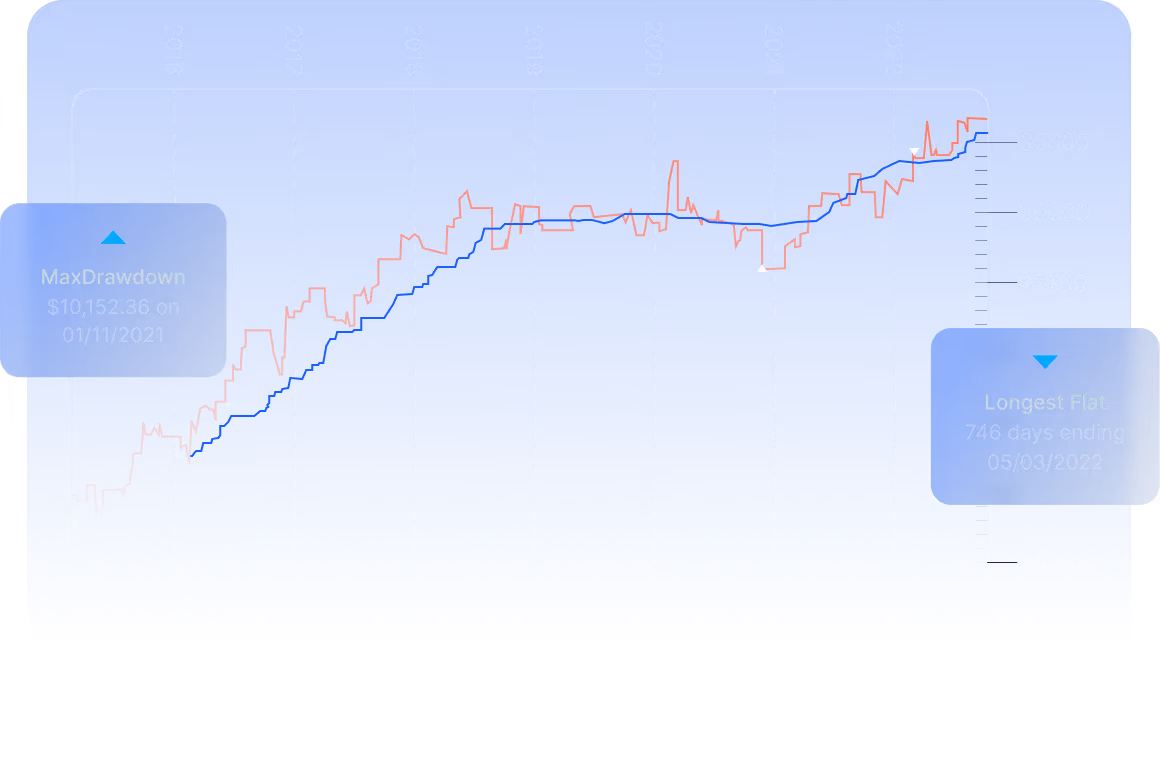
Proven & Backtested Strategies

Tested in Python and TradeStation with full performance results.

White bookmark icon inside a blue circular button.

Indicators & Optimization

Custom indicators, parameter tuning, and practical use cases.

White bookmark icon inside a blue circular button.

Lifetime Reference Archive

Reusable tactics and research you’ll revisit again and again.

Line chart showing growth from 2016 to 2022 with annotations for max drawdown of $10,152.36 on 01/11/2021 and longest flat period of 746 days ending 05/03/2022.

Access

Why Wealth Hub Archive?

Whether you're refining a strategy or exploring new ones, the Archive gives you proven ideas, data-backed insights, and the tools to grow.

36

Data-Packed Issues

500
+

Pages Of Content

5000
+

Hours Of Research

Insights

What You Receive

Unlock powerful tools for trading success.

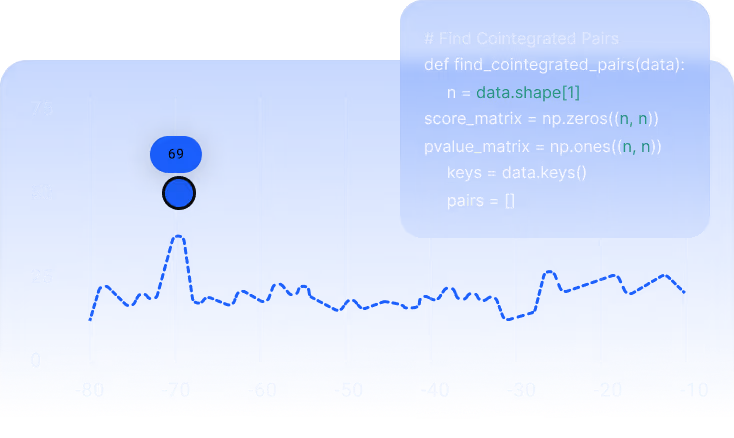
Algorithmic Strategies and Code

Backtested strategies with ready-to-use code for Python and TradeStation.

Scatter plot on a blue background with y-axis values from 0 to 75 and x-axis values from -80 to -10, highlighting a data point at x -70 and y 50 annotated with the number 69; overlayed Python code snippet defining a function to find cointegrated pairs.

Technical & Quant Frameworks

Understand the logic behind indicators, market structure, and trading systems.

Chart titled '12 Month Rolling Returns Global Trend-Asset Allocation Plus' showing a vertical axis from -20% to 50% with red arrows pointing at various positions around 30%, 15%, and -15%, emphasizing 'The Trend Is Your Friend!'

Strategy Playbooks

Strategy Playbooks: Tested approaches for different market conditions, clearly explained.

Line chart showing growth of four investment portfolios: Global Asset Allocation Plus, Global Asset Allocation, U.S. 60/40, and Global 60/40, all increasing over time on a logarithmic scale up to 12,800.

Core Concepts

Master the fundamentals that support long-term trading success.

Diagram illustrating market buy and sell orders with arrows indicating stop losses, take profits, limit orders, and buy limit prices on a blue background.

Proven Trading Concepts

Explore what markets reveal when data leads the way.

Scatter plot with light blue data points and a smooth red trend line illustrating forecasting patterns on a blue background.

Market Research

Explore tested ideas across styles, assets, and timeframes.

Cryptocurrency candlestick chart for SOL/USD showing green and red price movements over time with price levels around $0.0664.

testimonials

Trader Reviews

See why more than 1,800 professionals rely on our insights.

Five blue stars in a horizontal row on a transparent background.
What stood out to me was the clarity. So many trading resources overcomplicate things. Here, everything is structured and easy to understand.
Elias Meyer

Systematic Trader, Zürich

Five blue stars in a horizontal row on a transparent background.
I bought it out of curiosity and ended up staying up half the night reading through the setups. The layout is clean, and the strategies make sense. Worth every cent.
Daniel Reid

Macro Analyst, Toronto

Five blue stars in a horizontal row on a transparent background.
The Archive isn’t just theory it’s practical, no-nonsense content for serious traders. You can tell it was written by someone who understands the markets.
Peter Klein

Investment Strategist, Frankfurt

Five blue stars in a horizontal row on a transparent background.
I’ve been trading for over a decade, and this is one of the few resources that actually adds value. The strategies are smart, the insights are deep, and everything’s backed by data.
Tom Becker

Independent Trader, New York

Five blue stars in a horizontal row on a transparent background.
This archive is a goldmine. As a quant analyst, I found the code examples clear and easy to adapt. The mix of Python and TradeStation logic is rare to find in one place.
Emily Rhodes

Quantitative Analyst, Chicago

Five blue stars in a horizontal row on a transparent background.
As a Portfolio Manager, I’m always looking for real-world-tested strategies. The Wealth Hub Archive delivered beyond expectations. It’s packed with well-documented backtests and detailed setups I could actually implement.
Michael Grant

Portfolio Manager, London

Explore

Get the Full Collection

Unlock a treasure trove of strategies to enhance your trading success today.

A tilted financial report page showing an equity curve graph with red and blue lines, over a WealthHub Archive brochure with titles related to market volume and Wall Street trades.

Wealth Hub Archive

Your go-to strategy vault for practical trading insights, tested ideas, and no-fluff research.

$490 One-time payment

500+ pages of content
36 complete issues
Python & TradeStation code included
Actionable trading setups
Coming soon

One-time payment

Preview

Explore Sample Issues

Try us on for size.