Discover how to use COT commercial short data to anticipate commodity price moves and gain an edge by following the market’s smartest players.
The CFTC collects data on the daily positions of large participants in the commodity markets. The data is aggregated in the weekly COT report which is published every Friday at 3;30 PM EST. So the one million dollar question is whether we can use this weekly report to predict price movements in individual commodity markets ? Our focus lies on the trading group that usually leads returns. For the purpose of our analysis we will explore whether certain market participants in the crude oil market have information that isn’t available to all market participants. We will try to find out if this information is present in the COT report and therefore use the commercial short category in our calculations. The goal is to enable us to predict future price movements by quantifying the information given in the commercial short category of the COT report.
COT Report Basics
The Commitments of Traders (COT) reports provide a breakdown of each Tuesday’s open interest for markets in which 20 or more traders hold positions equal to or above the reporting levels established by the CFTC. Within the COT report traders are split into reporting and not reporting entities. The CFTC adjusts the minimum reporting threshold on a inconsistent basis . The aggregate of all traders’ positions reported to the Commission usually represents 70 to 90 percent of the total open interest in any given market. For the COT Futures-and-Options-Combined report, option open interest and traders’ option positions are computed on a futures-equivalent basis using delta factors supplied by the exchanges. Long-call and short-put open interest are converted to long futures-equivalent open interest. Likewise, short-call and long-put open interest are converted to short futures-equivalent open interest. For example, a trader holding a long put position of 500 contracts with a delta factor of 0.50 is considered to be holding a short futures-equivalent position of 250 contracts. A trader’s long and short futures-equivalent positions are added to the trader’s long and short futures positions to give “combined-long” and “combined-short” positions.
In 2009 the CFTC began with a reorganization of its original commercial and non commercial cot report by replacing them with four new categories of reportable traders: Producer/Merchant/Processor/Users, Swap Dealers, Money Mangers and Other Reportables. The new Producer/Merchant/Processor/User category replaces the original Commercials category. The report with the new categories began publication in 2009 and data with the new categories is available from June 2006.

Commercial Short Modeling
Before we proceed further to the actual analysis we need to find a model for the commercial short category which enables us to come to meaningful conclusions and trading signals. Therefore we think it doesn’t make any sense to compare longs vs. shorts within the commercials category(Producer/Merchant/Processor/User). Traders on each side of this market are clearly different. Commercials(Hedgers) are expected to be only on one side of the market. What we want to achieve is to identify the information held by commercial shorts yet not identified by a move in price. Therefore our model will focus on commercial short open interest. Our model is based on the assumption that commercial short open interest should rise when prices rise and fall when prices fall. We want to identify weekly changes in commercial short open interest. If there’s an unusual week to week price change the open interest change is ignored since we had a price move that can be explained by the change in open interest. In those cases where we don’t have a corresponding price change we have our trading signal.
Strategy Description: A sharp rise in the number of contracts held by commercial shorts is a bearish price signal. Shorts are increasing their positions locking in prices at the current level. A reduction in the number of contracts held by commercial shorts would represent a bullish price signal. Hedging activity decreases which should be followed by higher prices. For out backtest we define the trading signal as a 5% change in commercial short open interest during a one week period. A price change of 2% or less during a one week period gives us the entry signal. The position is entered on the Friday settlement price or Monday market opening. The position exit is when the price hits the 5% target in the anticipated direction. An opposite trading signal closes the position.
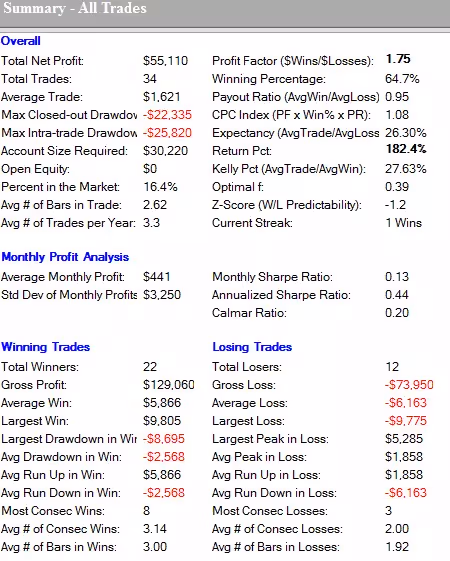
Strategy Results:
Additional Insights from Larry Williams
COT Extremes: Large positions at historical extremes often signal turning points. If commercial shorts reach unusually high levels, the market may be near a top, and vice versa.
Trend Confirmation: COT data is most reliable when used in conjunction with trend-following indicators. For instance, combining short-interest signals with moving averages or momentum measures can reduce false signals.
Timing Matters: Larry Williams recommends using the weekly report in conjunction with market context—price trends, seasonality, and macro factors—to improve predictive power.
Note: The COT report, particularly the commercial short category, provides a unique window into informed market behavior. By isolating weeks where short interest changes are not immediately reflected in price movements, traders can identify potential market turning points.
Key takeaways:
Commercial shorts act as informed hedgers: Their changes in positions often precede price movements.
Filter for price-independent changes: Avoid signals that simply reflect recent price trends.
Combine with risk management: Even with strong signals, proper stop losses and position sizing are essential.
Context is critical: Use COT data alongside technical indicators, seasonality, and macroeconomic factors.
Following these principles allows traders to harness the insights of informed participants and develop a systematic trading edge, just as Larry Williams has demonstrated in commodities over decades. While the COT report is not a crystal ball, it is a powerful tool for probabilistic market prediction when analyzed correctly.
Additional Insights for COT-Based Trading
- Extreme Position Analysis
Larry Williams often emphasizes that extreme positioning is where the edge lies. Look for commercial shorts or longs at historical 90–95th percentile extremes. When extremes occur, markets are prone to reversals, not continuation. You can track extremes using a simple percentile calculation over the last 5–10 years of weekly data. - Combining COT with Price Patterns
Don’t rely solely on short interest. Combine signals with:- Trend confirmation (e.g., 50-day moving average)
- Momentum oscillators (RSI, Stochastic)
- Seasonal cycles (Williams’ research shows commodities often have predictable monthly/quarterly cycles)
- Filter Out Noise
Ignore short interest changes that are fully explained by price moves in the same week. Focus on information-driven activity, which has predictive value. - Multiple Time Frames
Use weekly COT data to identify the directional bias, then enter trades on daily or even intraday bars to refine entry and exit timing. - Risk Management
Even “perfect” signals require strict stop-loss and position sizing rules. Use Larry Williams’ Optimal F for calculating the ideal position size based on historical win/loss distributions.
TradeStation/EasyLanguage Template for COT-Based Strategy
Below is a flexible and powerful template that can serve as a foundation for trading strategies using commercial short positions. You’ll need weekly COT data imported into TradeStation.
Inputs:
    COT_Change(5),       // Minimum % change in commercial shorts
    Price_Change(2),     // Max price change allowed for a valid signal
    Profit_Target(5),    // % price move in anticipated direction to exit
    Stop_Loss(3);        // % stop loss

Vars:
    CommercialShorts(0),
    WeeklyPriceClose(0),
    Signal(0),
    EntryPrice(0);

// Load weekly COT data into 'CommercialShorts' for the current week
CommercialShorts = Close of Data2;   // Assuming Data2 contains COT weekly data
WeeklyPriceClose = Close of Data1;   // Data1 is your daily or continuous contract

// Compute weekly % change
Vars:
    ShortChange(0), PriceMove(0);

ShortChange = (CommercialShorts - CommercialShorts[1]) / CommercialShorts[1] * 100;
PriceMove = (WeeklyPriceClose - WeeklyPriceClose[1]) / WeeklyPriceClose[1] * 100;

// Generate signal only if price change is small
If AbsValue(PriceMove) <= Price_Change Then Begin
    If ShortChange >= COT_Change Then Signal = -1; // Bearish signal
    If ShortChange <= -COT_Change Then Signal = 1; // Bullish signal
End Else Signal = 0;

// Execute trades
If Signal = 1 Then Begin
    Buy ("COT_Long") Next Bar at Market;
    EntryPrice = Close;
End Else If Signal = -1 Then Begin
    SellShort ("COT_Short") Next Bar at Market;
    EntryPrice = Close;
End;

// Exit rules
If MarketPosition = 1 Then Begin
    If Close >= EntryPrice * (1 + Profit_Target / 100)
       Or Close <= EntryPrice * (1 - Stop_Loss / 100) Then Sell ("Exit_Long") Next Bar at Market;
End;

If MarketPosition = -1 Then Begin
    If Close <= EntryPrice * (1 - Profit_Target / 100)
       Or Close >= EntryPrice * (1 + Stop_Loss / 100) Then BuyToCover ("Exit_Short") Next Bar at Market;
End;
Features of this template:
- Uses commercial short changes as predictive signals.
- Filters out noise from weeks with large price movements.
- Flexible entry and exit logic with configurable profit target and stop loss.
- Can be extended to include trend filters, moving averages, or momentum indicators.
Extra Tips to Maximize Edge
- Monte Carlo Testing – Simulate multiple paths to check robustness, as backtests on limited data can overfit.
- Seasonality Overlay – Combine COT extremes with seasonal tendencies (e.g., crude oil summer demand cycles).
- Correlation Check – Monitor correlated commodities to avoid taking redundant positions.
- Dynamic Stop Losses – Instead of a fixed 3%, consider ATR-based stops to adapt to market volatility.
- Portfolio Scaling – Use commercial short signals across multiple commodities for a diversified strategy.
By decoding the hidden moves of the market’s smartest players, you’re not just trading you’re stepping into the system, seeing the patterns before they unfold, and claiming an edge most will never even recognize.