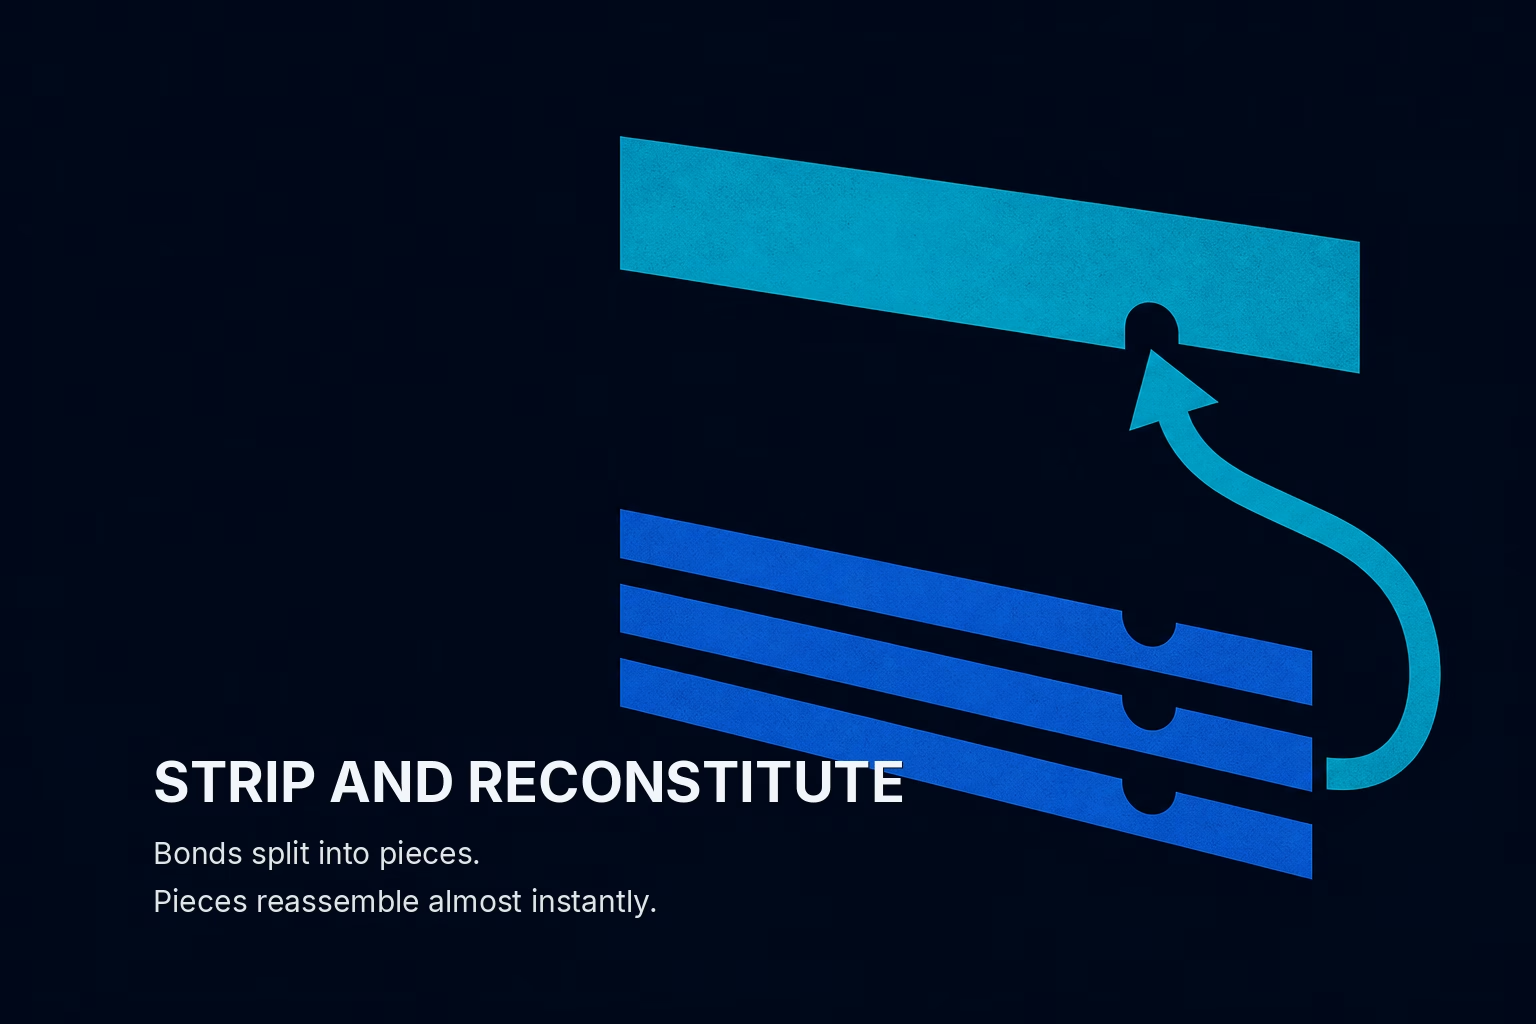
The interesting number in the Fleming and Shachar work is not the $560 billion held in stripped form. It is the churn underneath it: $1,827 million stripped and $1,567 million reconstituted on an average day between July 2024 and June 2025. Those two flows nearly cancel. A market where creation and destruction run within 15 percent of each other every day is not a market accumulating a position. It is an arbitrage engine, and until now the tape that would have shown it was invisible in FINRA's public volume series.
That gap matters because STRIPS are not a sideshow. They are the instrument that gives you the cleanest reading of the Treasury yield curve, since each zero-coupon component prices a single dated cash flow with no reinvestment assumption baked in. When the pricing of that instrument is driven by a flow nobody could see, the curve read everyone trusts inherits a blind spot.
The Flow Is the Story, Not the Stock
Consensus looks at the stock figure and concludes STRIPS are a quiet, buy-and-hold corner of the market: 2.5 percent of the $22.2 trillion in marketable notes, bonds, and TIPS outstanding, dominated by long-duration pension and insurance money. That framing is not wrong about who holds the paper. It is wrong about what moves it.
The daily stripping and reconstitution flows tell the operative story. Reconstitution happens, as the authors note, when demand for the fully constituted security pushes its price above the summed value of its component pieces. Stripping happens on the reverse dislocation. So the near-balance between $1,827 million created and $1,567 million destroyed every day is the fingerprint of dealers and relative-value desks arbitraging the spread between a whole bond and its parts. The net addition to stock, roughly $260 million a day, is the residue. The gross activity, more than $3.3 billion a day of combined stripping and reconstitution, is the real trade.
This is a positioning read, not a price read. The price of a long STRIP will look placid. What is actually happening is a constant recycling of the same securities across the strip-versus-whole boundary, and that recycling is a hedging and arbitrage flow that the public volume tape did not capture. The tape showed you Treasuries trading; it did not show you the components being manufactured and unmanufactured underneath.
Why the Long End Concentrates the Risk
The composition is where the flow becomes a curve problem rather than a curiosity. Bonds account for 98.1 percent of Treasuries held in stripped form, notes 1.9 percent, and TIPS effectively zero at 0.002 percent. Both the stock of stripped securities and the daily flow concentrate in long-maturity bonds.
That concentration is not an accident of taste. Long-maturity zero-coupon STRIPS carry the highest duration of any Treasury cash instrument, because there is no coupon stream to shorten the effective maturity. A 30-year principal STRIP is the purest long-duration exposure the Treasury complex offers. Liability-driven investors want exactly that to match distant pension and insurance liabilities, and speculators want it because a small yield move produces an outsized price move.
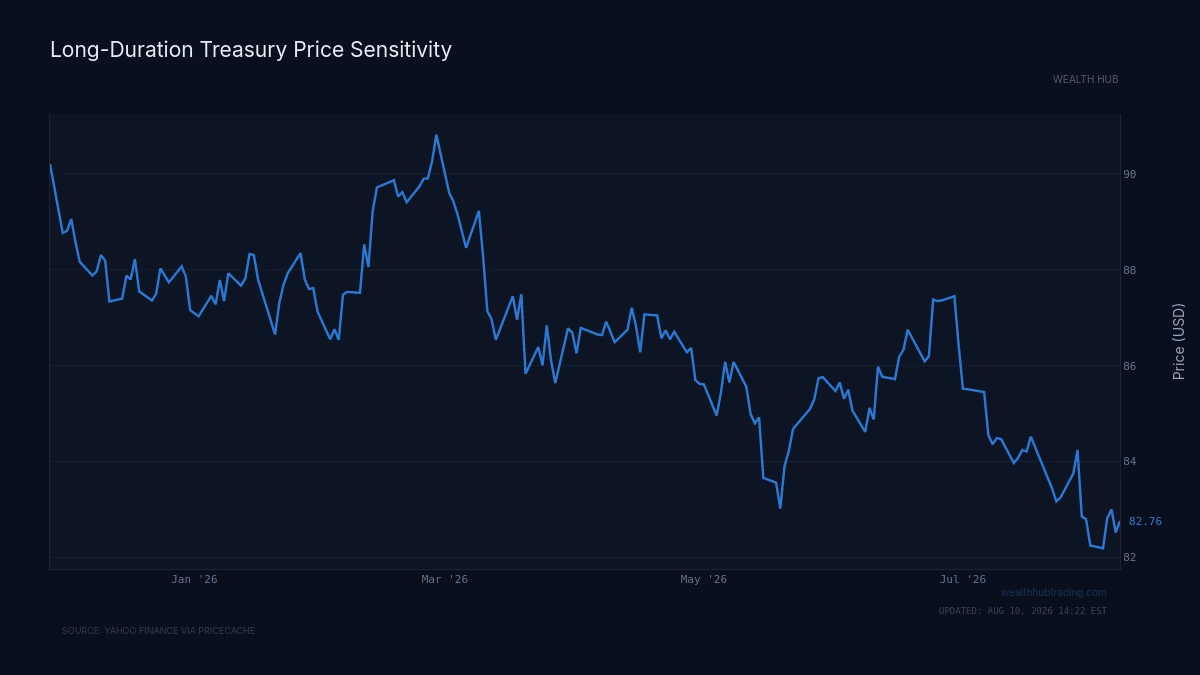
Put the flow and the composition together and the implication sharpens. The arbitrage churn is concentrated in the part of the curve where duration is highest and where a single large liability-driven buyer or a single levered speculator can shift the strip-versus-whole spread. When that spread moves, the stripping and reconstitution flow responds mechanically, and that flow is precisely what the public data omitted. The long end of the curve, the part most sensitive to positioning, is the part where the hidden flow is densest.
What the Newly Visible Data Actually Adds
The value of bringing TRACE transaction data to bear on STRIPS is that it converts an inferred flow into an observed one. Before this, an analyst could reason that strip-reconstitution arbitrage must exist and must cluster at the long end, but could not measure the trading activity directly, because FINRA's aggregate public series began reporting Treasury volume in March 2020 without breaking out STRIPS.
Observed flow changes what you can do with a curve signal. If the strip-versus-whole spread widens and reconstitution volume spikes, that is a demand signal for the fully constituted bond that a pure price series would register only with a lag. If stripping volume surges at the 30-year point, that is duration demand arriving before it shows up cleanly in the on-the-run yield. The flow leads the tape because the flow is the mechanism that adjusts the tape.
The Case Against Reading Too Much Into It
The honest counterargument is that this flow is mostly plumbing, not signal. If stripping and reconstitution are dominated by mechanical relative-value desks capturing a few basis points, the flow may be noise that nets to near-zero precisely because it is arbitrage doing its job. A market where creation and destruction run in near-balance every day is, on one reading, a market working efficiently, not a market telegraphing direction. The $260 million average daily net addition is small against a $560 billion stock; the churn may signify liquidity provision rather than a positioning shift worth trading on.
There is also a scale objection. At 2.5 percent of marketable Treasury debt, STRIPS are too small a slice to move the broad curve on their own. A dislocation in strip demand tells you about strip demand; it need not propagate to the whole 10-year or 30-year yield.
Both objections are fair, and both are testable against the data the authors have now opened. The plumbing view predicts that stripping and reconstitution volumes stay tightly coupled and spike together, symmetric around a stable spread. The signal view predicts asymmetry: episodes where reconstitution outruns stripping for a stretch, or the reverse, coinciding with directional moves in long-end demand. The distinction is measurable now in a way it was not before March 2020, and it was not measurable in the public STRIPS breakdown at all until this analysis.
Where This Gets Interesting Next
The thesis breaks if the newly visible STRIPS flow turns out to be symmetric arbitrage that never leads the long-end yield. In that case the churn is confirmation that the market is efficient, and the flow is a diagnostic of liquidity rather than a leading indicator of positioning.
It holds if the flow shows persistent directional imbalances at the long end that precede moves in 30-year demand. The observable condition to watch is the ratio of daily reconstitution to daily stripping. A sustained drift away from the roughly $1,567 million to $1,827 million balance, concentrated in long-maturity bonds, would be the flow forcing the tape rather than following it. That is the read the public volume series could never give you, and it is the reason the STRIPS trading data now being surfaced is worth more than the stock figure it sits beneath.


