The 2008 comparison is doing analytical work it cannot support, and the reason is buried in the permit data, not the price data. Home builders quietly r...
The 2008 comparison is doing analytical work it cannot support, and the reason is buried in the permit data, not the price data. Home builders quietly reallocated capital away from single-family and into multifamily before the crash narrative even took hold. New single-family permits fell 11.7% year over year in July 2022 on a seasonally adjusted basis while multifamily permits rose 26.2%. That is not the behavior of an industry bracing for a repeat of 2008, when the collapse came from oversupply of owner-occupied stock financed by borrowers who could not carry it. The market is pricing a demand shock. The builders are responding to a supply-composition shift. Those are different theses, and only one of them is in the guidance.
The National Number Is the Wrong Unit of Analysis
Every widely quoted forecast disagrees, and the disagreement itself is the tell. Zillow forecasts a 1.4% year-over-year increase. Moody's models anywhere from flat to a 5% decline. When two credible shops land on opposite signs for the same variable, the variable is being measured at the wrong resolution. A national home-price figure aggregates markets that have almost nothing in common: a Sun Belt metro absorbing remote-work migration behaves nothing like a coastal market that already repriced.
The cleaner unit is the metropolitan statistical area. At the MSA level, a small set of local metrics explains year-over-year price change far more reliably than any national aggregate, and Zillow's ZHVI series gives a usable home-price approximation back to 2008 for the major markets. From 2010 to 2019 a single variable dominated the explanation of local price change. That is the analytical spine of this series, and it is precisely what the crash-versus-boom debate discards when it collapses everything into one headline print.
The median-price-to-median-income ratio, the metric most often cited to argue homes are unaffordable, is one of the worst offenders. It divides a median price by a median income, but the people actually transacting are not the median household. They sit in the upper home-buying income deciles. Measured against the incomes of people who actually buy homes, purchasing power holds in most markets even if the 30-year fixed pushes past 6.5%.
What the Wage Data Discloses That the Price Data Hides
The bear case leads with the price move: median sale price up 36.5% in 2022 Q2 versus 2019 Q2. Cited alone, that number looks like a bubble. Set it against the denominator and it looks like repricing to fundamentals. Wages rose 16.1% nationally from 2019 Q1 to 2022 Q1, and 6.7% year over year. Employment has passed its pre-COVID level. A price rise partly funded by durable income growth is a different risk than a price rise funded entirely by cheap credit and speculation, which is the 2008 template.
The remote-work channel widens the gap further. A National Bureau of Economic Research working paper attributes roughly half of the pandemic-era price rise to shifting location preferences. That is a structural demand reallocation, not a leverage bubble. It moves where demand sits without necessarily inflating aggregate credit risk, and it explains why price behavior fractures so sharply by metro.
Demand is also demographic, and demographics disclose slowly. Millennials occupy the 26 to 41 age band in 2022, the prime first-purchase window, and the cohort runs roughly 10% larger than Gen X, six to seven million additional people. That is a standing bid that does not evaporate when the 30-year fixed hits 6.02%, the weekly average recorded on September 15, 2022. It defers.
The Sidelined Buyer Is Not the Departed Buyer
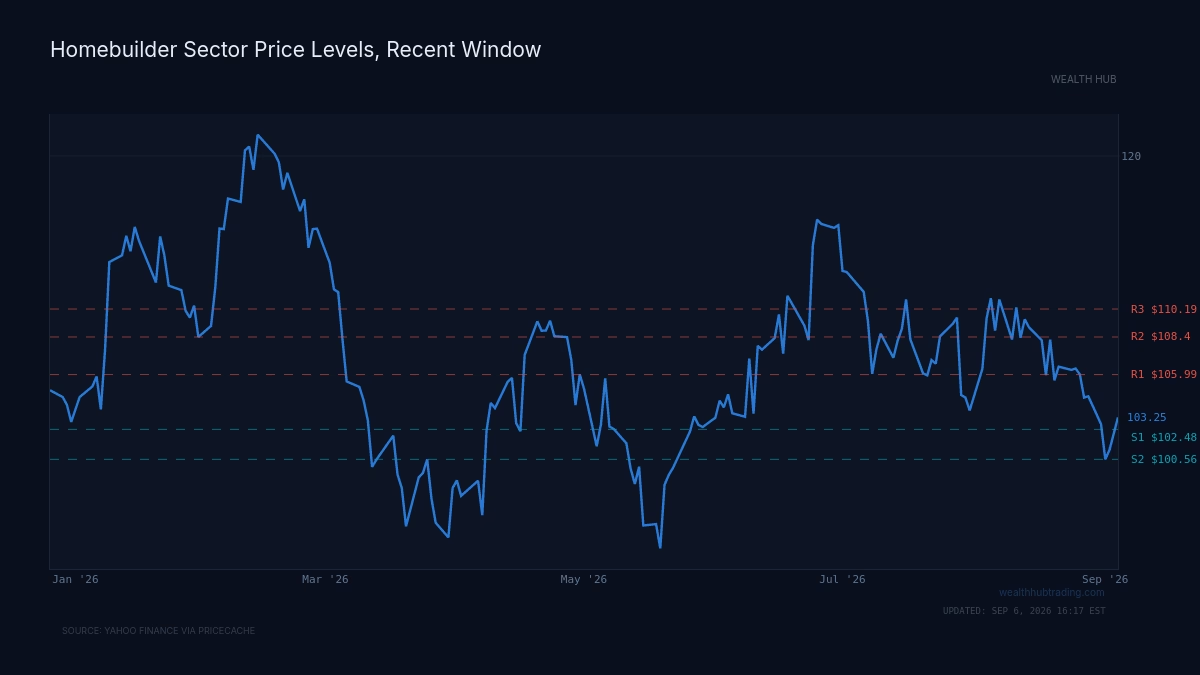
The strongest read on July's 5.9% sequential drop in existing home sales is that buyers stepped back to wait out volatility, not that the bid disappeared. The distinction is measurable. A UBS Consumer Labs report found search interest for existing homes up 1.6% and for new homes up 22.1% from late May through August 2022. Interest that migrates toward new construction while transaction volume cools is the signature of deferral under rate uncertainty, not demand destruction.
NAR's read reinforces the split. Yun described a housing recession in sales and construction volume while explicitly denying a recession in prices, with inventory still tight and nearly 40% of homes commanding full list. A market where 40% of listings clear at ask is not distributing inventory into a vacuum. It is rationing scarce supply to a demand pool that has thinned at the margin but not collapsed.
Where the Thesis Could Break
The honest weakness is duration. Every supporting argument, wage growth, demographic demand, remote-work reallocation, assumes buyers can wait out the rate shock. If the 30-year fixed holds well above 6.5% for long enough, deferred demand becomes destroyed demand as household formation slips and affordability erodes faster than wages compound. The multifamily permit surge cuts both ways here: rising rental supply eventually pressures the rent-versus-buy math that has propped up owner-occupied demand, and a genuine recession would hit employment, the load-bearing beam under the entire wage argument.
There is also a composition risk the national data masks in the other direction. If migration-driven demand concentrated the price gains in a handful of Sun Belt metros, those specific markets carry more downside than the aggregate implies, precisely because their run-up was steepest and their local income base thinnest relative to inbound buyers. MSA-level analysis protects against a national miscall but exposes concentrated local vulnerability.
The condition that resolves it is observable and specific. Watch whether the single-family-to-multifamily permit divergence persists into 2023 alongside a stable or falling 30-year fixed. If builders keep starving single-family supply while rates ease and search interest holds, tight inventory meets deferred-but-intact demand and prices grind higher at a slower rate in most markets, which is the base case the crash narrative cannot see. The thesis breaks if employment rolls over and the permit divergence reverses, because that is the sequence, oversupply meeting a demand shock, that actually rhymes with 2008. Until that shows up in the data, the balanced reading of the evidence is not a crash. It is a repricing that has largely already happened.