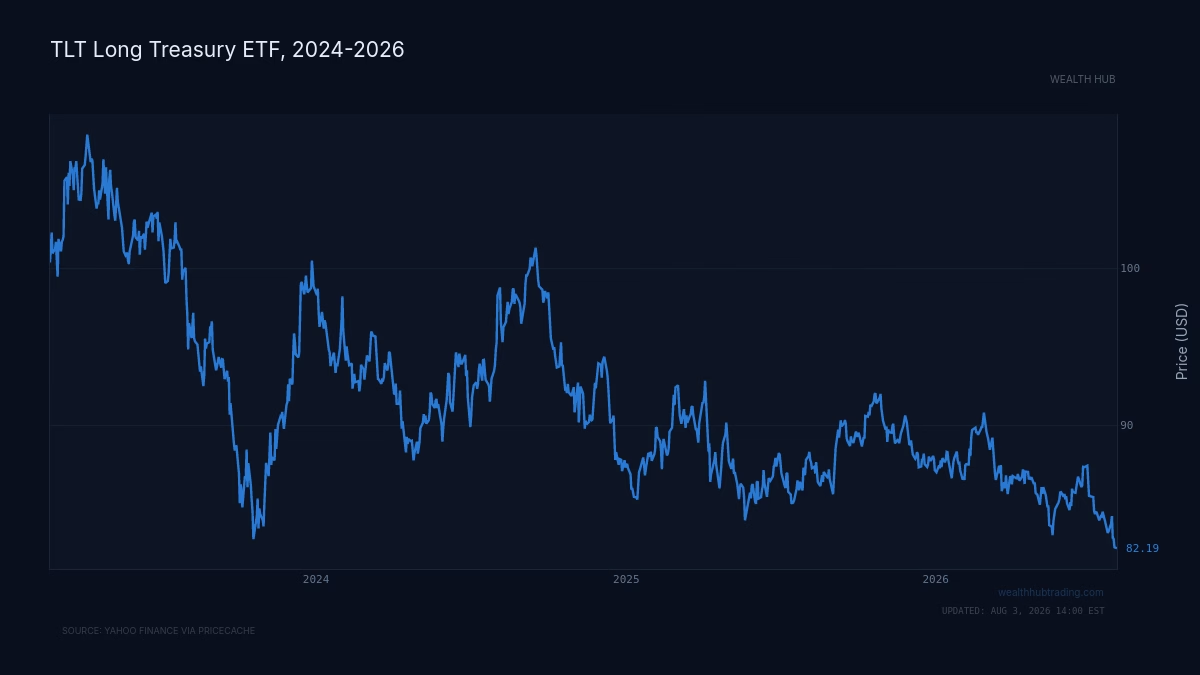
On the morning of a Fed Day in 2026, the setup was familiar to anyone who had watched the previous four years. Inflation sat stubbornly above the 2% target the Federal Reserve had defended since it formalized the figure in January 2012. The 10-year Treasury traded at 4.75%, the 2-year at 4.28%, the curve a modest 47 basis points of positive slope. The CPI index stood at 332.6. Nothing in that picture screamed crisis. And yet the committee was again preparing to explain why a number that had never had a rigorous theoretical derivation remained the fixed star of American monetary policy.
The interesting fact about the 2% target is that almost no one who defends it can tell you where it came from. It was not calculated. It was, in the most literal sense, made up — and the story of how it was made up, and how it hardened into orthodoxy, is a case study in a pattern that recurs across financial history: a convenient round number, adopted for expedience, calcifies into a law nobody dares question, and then the world moves and the number stays put.
The number that was invented in an afternoon
The origin story is well-documented and slightly embarrassing. In late 1989 the Reserve Bank of New Zealand became the first central bank in the world to adopt a formal inflation target. The Finance Minister at the time, Roger Douglas, mentioned in a television interview that he wanted inflation somewhere around zero to one percent. The central bank governor, Don Brash, needed to translate that offhand political remark into an operational band, and the range that emerged was 0 to 2%. There was no model behind the upper bound. It was a negotiation, conducted quickly, in the shadow of a politician's television appearance.
From New Zealand the idea spread. Canada adopted a target in 1991, the United Kingdom in 1992 after being ejected from the Exchange Rate Mechanism, Sweden in 1993. The 2% figure — sometimes as a ceiling, sometimes as a midpoint — travelled with the concept, less because it had been validated than because it had precedent. By the time Ben Bernanke's Fed formalized the 2% goal in January 2012, the number had the weight of two decades of institutional practice behind it. What it did not have was a first-principles justification. It was old, not proven.
That is the structural pattern worth naming. A round number, adopted for expedience by one actor under time pressure, becomes the default for the next actor, and the default becomes the standard, and the standard becomes the thing you are not allowed to question in polite central-banking company. The number acquires authority through repetition, not through evidence.
Where the pattern has broken before
The gold standard was a version of the same story. For roughly a century, the convertibility of currency into gold at a fixed price was treated by the men who ran finance ministries as a natural law of sound money rather than a policy choice. It was defended through the First World War's aftermath, through the deflation of the early 1930s, at enormous cost in unemployment and output, because the number — the parity — had become sacred. Britain returned to gold at the prewar parity in 1925 under Winston Churchill, a decision Keynes attacked at the time as a choice to impose deflation on workers to defend a symbol. The parity held until it could not, and when it broke in September 1931 the sky did not fall; sterling floated, and the recovery that followed was faster than the one endured by countries that clung to gold longer.
The Exchange Rate Mechanism supplied the same lesson a generation later. The Bank of England spent the reserves and raised the base rate to 15% on September 16, 1992, defending a fixed band that had become, in the minds of policymakers, a commitment that could not be abandoned without catastrophe. It was abandoned that afternoon. Sterling floated, and the British economy recovered rather than collapsed. The number the authorities had treated as load-bearing turned out to be a preference they could survive discarding.
In each case the mechanism is the same. A quantitative anchor is adopted for reasonable reasons. Over time the anchor is reinterpreted as a fundamental constraint rather than a chosen convention. The world changes around it. And the defense of the number begins to cost more than the number was ever worth, because the actors defending it have forgotten that it was chosen rather than discovered.
The counterpoint that gives the number teeth
Here the pattern acquires a complication, and it is the complication that makes the present episode more interesting than a simple repeat.
The case for lifting the target to 3% is, on its face, strong. Two structural forces argue for higher trend inflation over the coming decade. An ageing population and a shrinking workforce in the United States and Western Europe create persistent labour shortages, and those shortages feed wage inflation — a plausible half a percentage point on the trend rate. The end of the great globalisation dividend does the rest. The decades in which production kept migrating to ever-cheaper producers pushed goods prices structurally down; that tailwind has stopped, and its absence adds perhaps another half a point. One percentage point of additional structural inflation is a defensible estimate, and empirically the difference between a 2% and a 3% inflation regime is close to irrelevant for businesses and equity markets. It is only above roughly 4 to 5% — where the cost-of-living squeeze suppresses demand and margins compress because firms cannot pass costs through — that inflation becomes genuinely corrosive. On the economics alone, 2 versus 3 is a distinction without a material difference.
But Engin Kara of Cardiff University supplies the reason the number may not be as arbitrary as the gold parity or the ERM band. Working with microdata on price changes for roughly 340,000 consumer products sold in the United Kingdom between 2003 and 2021, Kara asked a behavioural question that the macro debate had skipped. When a firm sees a competitor raise prices, does it follow?
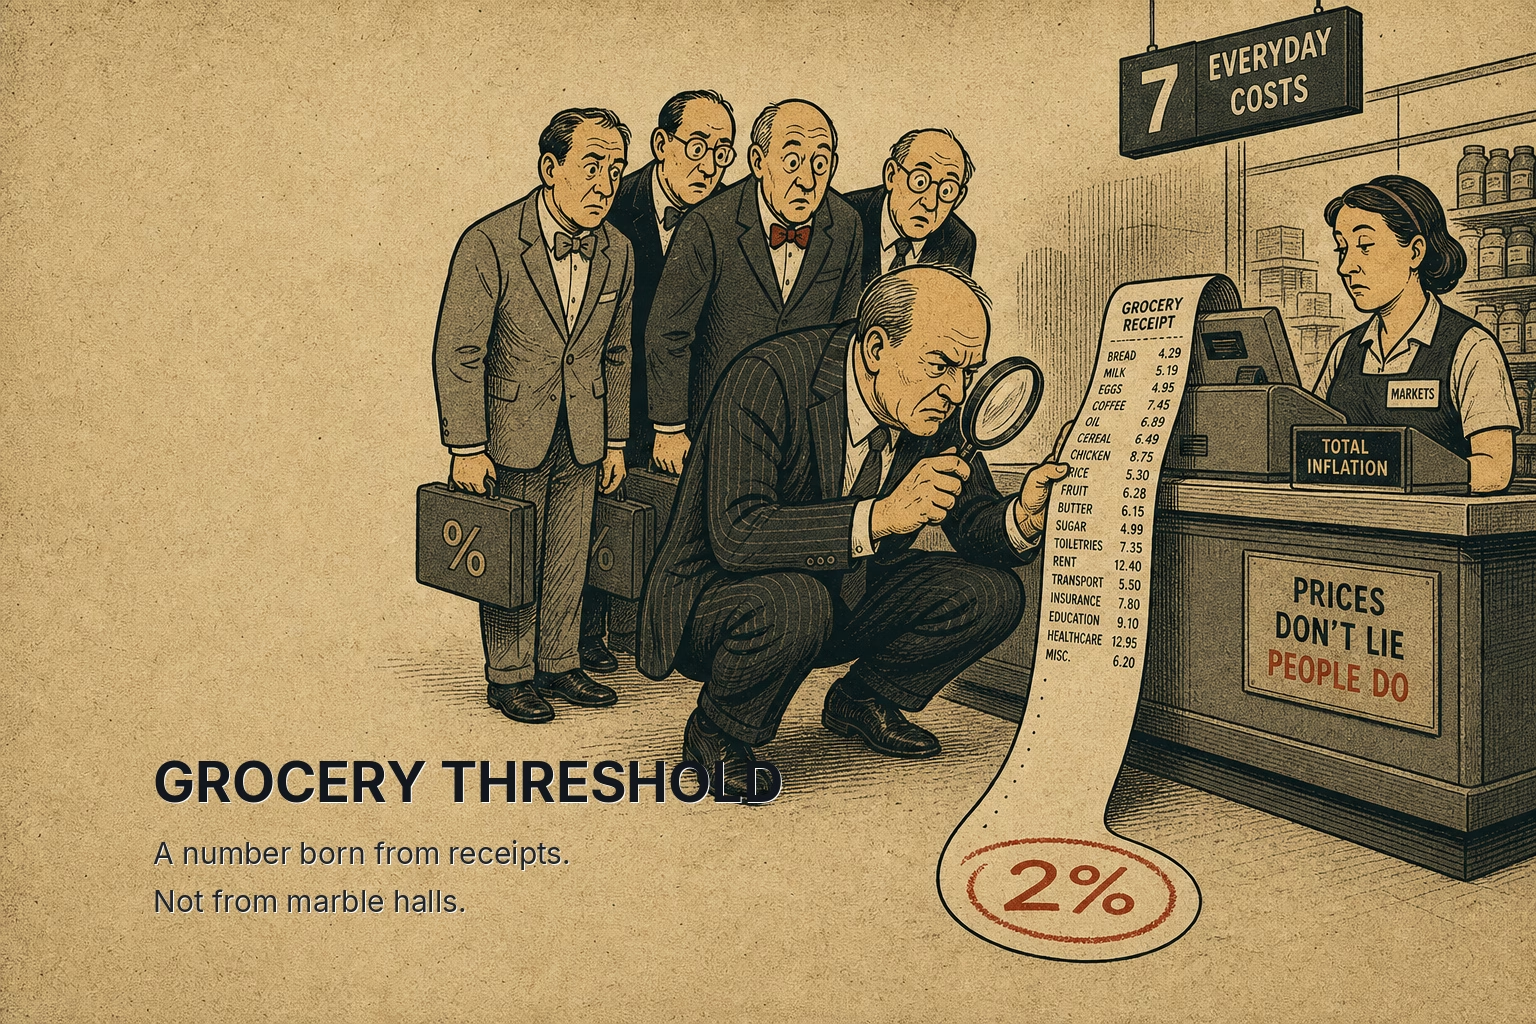
The answer, empirically, depends on a threshold. Below about 1.9% — the typical annual price increase across most UK industries — a firm treats a competitor's price rise as idiosyncratic: a reaction to that competitor's own costs or strategy, safely ignored. Holding your own price steady is the winning move, because when input costs fall back you keep your margin and undercut the competitor who jumped early. Above 1.9%, the interpretation flips. A price increase larger than the customary annual move is read not as one firm's problem but as a universal, persistent cost signal. So firms follow. And the following is self-reinforcing: once the threshold is crossed, herd behaviour amplifies the initial move, and monetary policy loses some of its grip because expectations have coordinated around the belief that everyone will raise prices.
That is the one way this time is not like the gold standard or the ERM. Those numbers were pure conventions — a parity, a currency band — with no behavioural content. The moment they were abandoned, nothing in private decision-making broke, because the numbers had never lived in the heads of the people making pricing and wage decisions. Kara's 1.9% threshold is different in kind. It is not a policymaker's convenience projected onto the world; it may be an emergent property of how firms actually read each other's prices. If that is right, the 2% target sits just above a genuine behavioural cliff, and moving the target to 3% would mean deliberately operating in the regime where the herd switches on.
I would still argue the structural case for a higher trend rate is sound, and that markets tolerate 3% without difficulty. The unverified link — and it should be flagged as such — is whether a threshold estimated from UK grocery-scanner data between 2003 and 2021 generalizes to the United States in 2026, across different industries and a different competitive structure. That is an empirical question the single study does not settle.
The lesson
Sometimes a number that governs a system is a pure convention, and the actors defending it have simply forgotten it was chosen; when that is the case, the number breaks cheaply and the world barely notices, as sterling demonstrated in 1931 and again in 1992. But sometimes a number that looks like a convention has quietly become a coordination point in the behaviour of the people the policy is meant to govern, and then it is not arbitrary at all — it is the fence at the edge of a cliff, and the fact that no economist derived it from first principles tells you nothing about whether it is holding something back. The 2% target may be both stories at once: a made-up figure with no theoretical pedigree, and, by accident, a threshold that sits close to where firms stop ignoring each other and start following. The task for this Fed Day, and the ones after it, is to work out which of those two numbers they are actually defending.


