A 6.3% producer price print does not slam "businesses" as a group. The Producer Price Index measures the prices sellers receive. Every point of it is a cost to one company and revenue to another. September's report says less about corporate America being squeezed than about a transfer of margin, out of consumer-facing firms and into energy, freight and distribution. The widest gap since 2022 between business-to-business inflation (6.3% year-over-year) and consumer inflation (3.7%) is the clearest sign of where that transfer is landing. Earnings guidance will tend to describe it in soft language, such as "pricing actions," "mix" and "cost discipline," well before the gross-margin line shows the damage.
The Wedge Between 6.3% and 3.7%
The Bureau of Labor Statistics put final-demand PPI up 1.3% in September from August, a 17.4% annualized pace. That took the year-over-year rate to its highest since December 2022. Core PPI, which strips out food and energy, rose 0.68% on the month and 5.0% year-over-year, the worst since January 2023. Services make up 68% of final demand, and they rose 0.82% month-to-month and 4.9% year-over-year, matching the worst readings since late 2022. Consumer prices accelerated too, but only to 3.7%.
The fast reading treats that 260-basis-point gap as cost businesses have not yet passed on. Some of it is exactly that. The more useful question is which businesses sit on which side of it. The two subindexes driving the services spike answer that directly.
Transportation and warehousing prices jumped 2.2% in the month (29.3% annualized) and 12.4% year-over-year, the steepest since October 2022. Rising diesel costs did much of the work. That 12.4% is a cost to every shipper, manufacturer and retailer moving goods. It is revenue to the carriers and warehouse operators who billed it.
Energy is more extreme. The energy PPI rose 10.8% in a single month and 35.6% year-over-year, and its price level in September passed the June 2022 peak. A refiner, a diesel distributor or an upstream producer sees that as realized price. A food manufacturer, a trucking customer or a chemical buyer sees it as an input bill.

Trade Services Is a Margin Gauge, Not a Price Gauge
The headline coverage misses the most revealing line in the report. The BLS does not price trade services the way it prices steel or diesel. The trade services index measures margins: what wholesalers and retailers get for an item minus what they paid to acquire it. When that index rises, distributors are widening the spread between their buy and sell prices.
September's trade services PPI rose 1.38% month-to-month (17.8% annualized), after a weak August and a negative July. Year-over-year it was up 4.7%, a slowdown from August, but still roughly double the normal pre-pandemic range.
The month-to-month swing is noisy, and one strong month after two soft ones does not establish a trend. The year-over-year level does carry information. Trade margins running at about twice their old pace is not the profile of an intermediary sector being "slammed." It is the profile of a sector that has regained pricing power and is using it. Part of the headline 6.3% is therefore margin expansion booked by distributors, recorded in the official statistics as inflation.
That reverses the title's framing for a large slice of the economy. The businesses most exposed are the ones that pay trade margins, freight rates and energy costs and then sell to households at a 3.7% inflation rate. The consumer-facing end of the chain is where the wedge closes. It closes through lower gross margins, not higher shelf prices.
Where the Squeeze Lands on Income Statements
The PPI series map onto an income statement in a fairly direct way.
- Upstream energy and refining: realized prices rising faster than any other line, with the energy PPI above its 2022 peak. This is a revenue tailwind.
- Freight and logistics: a 12.4% annual price gain. Carriers pass through fuel surcharges and capture some of the spread. Diesel is their input too, so the net benefit depends on how quickly surcharges reset against fuel bills.
- Wholesale and retail trade: margins measured by the BLS itself, running at about twice their pre-pandemic pace year-over-year.
- Goods manufacturers: core goods PPI up 5.1% year-over-year, in that range for five straight months, the highest stretch since February 2023. Monthly momentum is milder at 0.27% (3.3% annualized), which suggests manufacturers are holding pricing rather than pushing it.
- Consumer-facing sellers: absorbing freight, energy and distributor margins while their customers face 3.7% CPI.
The sector baskets in this sketch are inferred from how the PPI categories are built. We have not pulled company-level filing data showing any specific firm's margin trajectory for the quarter, so the mapping is the mechanism, not a verified earnings call.
What the mechanism predicts is testable. Companies at the end of the chain, such as packaged-goods makers, restaurants, discount retailers and consumer durables, should report gross margins compressing faster than their pricing commentary implies. "We took pricing in the quarter" is a guidance phrase. Gross margin falling year-over-year is a filing disclosure. When a company raises price and its margin still falls, the cost wedge has beaten its pricing power. Investors who anchor to the pricing language rather than the margin line will be pricing the wrong number.
Food is a useful control case. The food PPI rose 1.2% in September after two negative months, yet it was flat year-over-year. Food manufacturers already absorbed a roughly 31% surge in input costs from mid-2020 through 2022, saw a plateau and a dip in 2023, and have drifted higher at a moderate pace since early 2024. Their pressure is now freight and energy, not ingredients. That narrows the margin story for packaged food to two channels, both of which spiked in September.
The Case Against the Wedge
The strongest objection is that 6.3% and 3.7% are not the same basket, so the gap partly reflects composition. CPI is heavily weighted toward shelter, which PPI final demand does not cover in the same way. Shelter inflation moves slowly and lags market rents. A CPI anchored by sticky but cooling housing costs will mechanically trail a PPI loaded with energy and freight during an energy spike. Some of the 260 basis points is a weighting artifact and not margin destruction.
PPI final demand also includes sales to government, exports and capital investment, not only goods and services headed for households. Not every point of producer inflation was ever meant to reach a retail shelf.
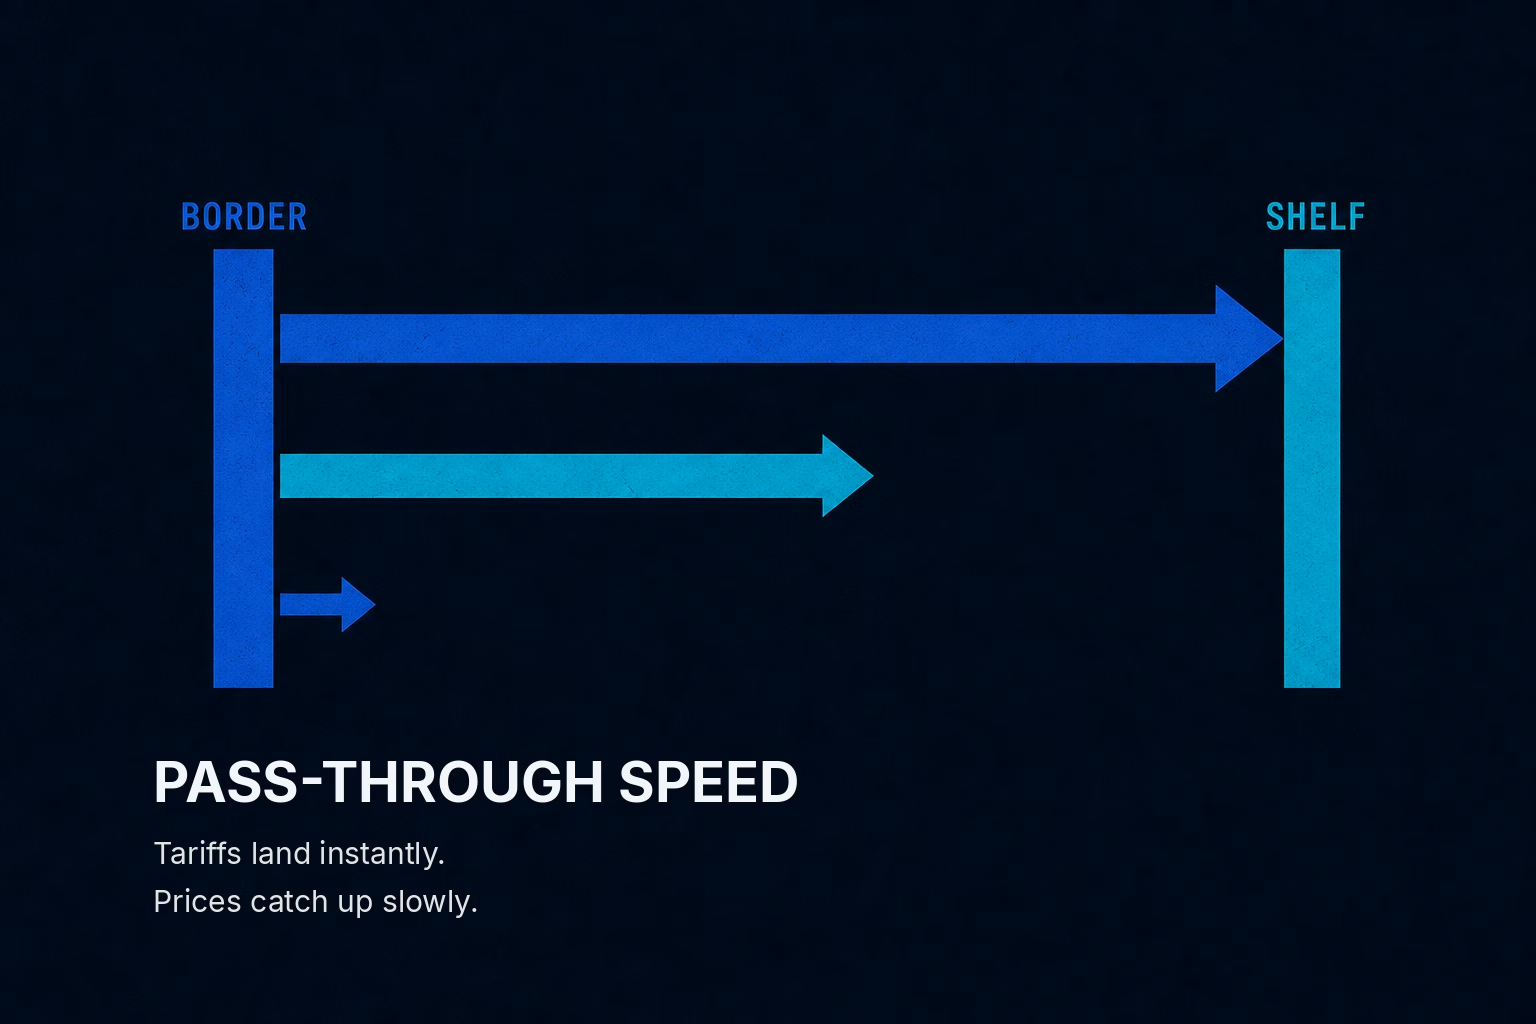
A second objection is timing. Pass-through from producer to consumer prices usually comes with a lag. September's PPI spike may simply be CPI's next few months. If that is right, the wedge is a delay, and consumer-facing margins recover as pricing catches up. The roughly two-year zigzag higher in both PPI and core PPI, from lows in mid-2023 and January 2024, gives that argument some force. Businesses have been passing costs along gradually rather than eating them indefinitely.
Neither objection removes the margin read. Both narrow it. The composition point explains part of the gap but not the trade services margin data, which measures intermediary spreads directly. The lag point says compression is temporary, but it requires consumers to accept higher prices at a time when CPI is already accelerating. The CPI report the day before showed consumer inflation broadening, which suggests some pass-through is under way. Whether demand holds as it does is the open question.
The Fed Is Cutting Into This
This is the one place where policy does real work in the argument. The Fed has been lowering its policy rate while business-facing inflation has climbed in a zigzag since mid-2023. The central bank targets consumer inflation, so a 6.3% PPI does not enter its reaction function directly. That is precisely why the wedge matters. Rate cuts support final demand, which is the condition consumer-facing firms need to push through the costs piling up upstream. Easier policy and a 3.7% CPI together let the transfer complete through prices instead of margins. If the Fed instead turned hawkish because CPI kept accelerating, consumer-facing firms would face higher input costs and weaker demand at once. That is the worst combination for the end of the chain.
What Confirms the Read
The first test arrives with Q3 GDP at the end of the month. The GDP price index covers every buyer, including consumers, businesses, nonprofits and governments, and it will show how much of the producer inflation reached the economy-wide deflator. A deflator running well above CPI would support the view that the business sector is carrying the burden.
The second test is the coming earnings season, and the decision variable is narrow: gross margin against stated pricing. Consumer-facing companies that report price increases alongside falling gross margins confirm that the wedge is being absorbed. Freight carriers and distributors reporting margin expansion confirm the other side of the transfer.
The read breaks if core goods CPI and services CPI accelerate quickly enough over the next two prints to close most of the gap with core PPI's 5.0%. That would mean pass-through is working and margins are being protected. Until then, the better interpretation of September's 6.3% is that a handful of upstream sectors are collecting the inflation, and the companies closest to the consumer are paying for it.