
The most important number in Dmitriy Muravyev's 2026 replication study is not the 42% of findings that survive in new data. It is the moment the decay begins: at the last observation of the original sample, before any investor has read the paper. For thirty years the profession has told itself a more flattering story, in which anomalies are real until publication and then get arbitraged away by readers. Muravyev's evidence points to a less comfortable account. A large share of what looked like market inefficiency was a property of the sample the researcher happened to hold.
The Cliff at the Sample Boundary
The study is unusual mainly in its scale. Muravyev built an autonomous pipeline on large language models that took each paper's description of its data and method, rebuilt the main result from the available databases, and passed every replication through an independent audit. He applied it to papers published in the Journal of Finance, the Journal of Financial Economics, and the Review of Financial Studies between 2000 and 2020. The pipeline produced 1,328 in-sample replications. For 1,005 of them, enough data had accumulated after the original sample to run a genuine out-of-sample test.
The in-sample results were reassuring. About 75% of key results kept their published sign and statistical significance when rebuilt independently. The median replicated coefficient came in at 93% of the published value. Only 1.3% of key estimates turned significant with the opposite sign. Most failures were quiet ones, where a result slipped below the significance threshold rather than reversing. On this evidence, finance does not have the fabrication or coding-error problem that has damaged other fields. The numbers in the tables mostly correspond to something in the data.
The out-of-sample results were a different matter. Only 42% of key results kept their sign and significance in later years. Adjusting for the lower precision of shorter post-sample windows lifted that to 48%. The median coefficient fell from 93% of the published estimate to 45%. A typical finding, in other words, kept less than half its advertised strength once it met data the author had not seen.
The timing is the most informative part. When Muravyev re-estimated each result year by year relative to the end of its sample, the coefficient ratio stayed roughly flat inside the sample, dropped by about 0.28 at the boundary, and then stayed roughly flat again. It did not fall further when the paper circulated or when it appeared in print. A gradual change in markets would produce a slope. Investors learning from the paper would produce a drop at publication. What the data shows is a cliff at the exact date the author stopped collecting observations.
Muravyev reads that pattern as more consistent with original-sample selection or data snooping than with investor learning. The history of empirical finance suggests the field has seen this cliff before and filed it under another name.
Banz, 1981, and the Premium That Left Early
In 1981 Rolf Banz published a paper in the Journal of Financial Economics showing that smaller NYSE firms had earned higher risk-adjusted returns than larger ones over a sample ending in the mid-1970s. It was one of the cleanest anomalies of its era: simple to compute, economically large, and hard to explain with the capital asset pricing model that dominated academic thinking. The finding fed directly into practice. Dimensional Fund Advisors was founded in 1981 with small-company investing at the core of its offering, and size later became one of the three factors in the Fama and French model of the early 1990s.
What followed did not resemble the premium in the paper. Small stocks had a poor stretch through much of the 1980s relative to large ones, and later research showed that a large part of the historical size effect had been concentrated in January and among the smallest, least liquid names, where trading costs absorbed much of the apparent return. The weakening began close to the point where Banz's data ended. Investors had not had time to arbitrage it away.
At the time, the reading most practitioners settled on was that the size premium had been discovered and then crowded. Muravyev's framework supports a different reading of the same chronology. If the premium's strength in the sample owed something to the particular decades studied and the choices made in defining it, the post-sample weakness was a reversion toward a truer and smaller number rather than a punishment for publicity.
The episode has a long tail. The size premium has never been fully abandoned and never fully rehabilitated, and the debate over it has outlasted most of the people who started it. Over the past three years small caps have mostly trailed large caps, four decades after the effect was first published.
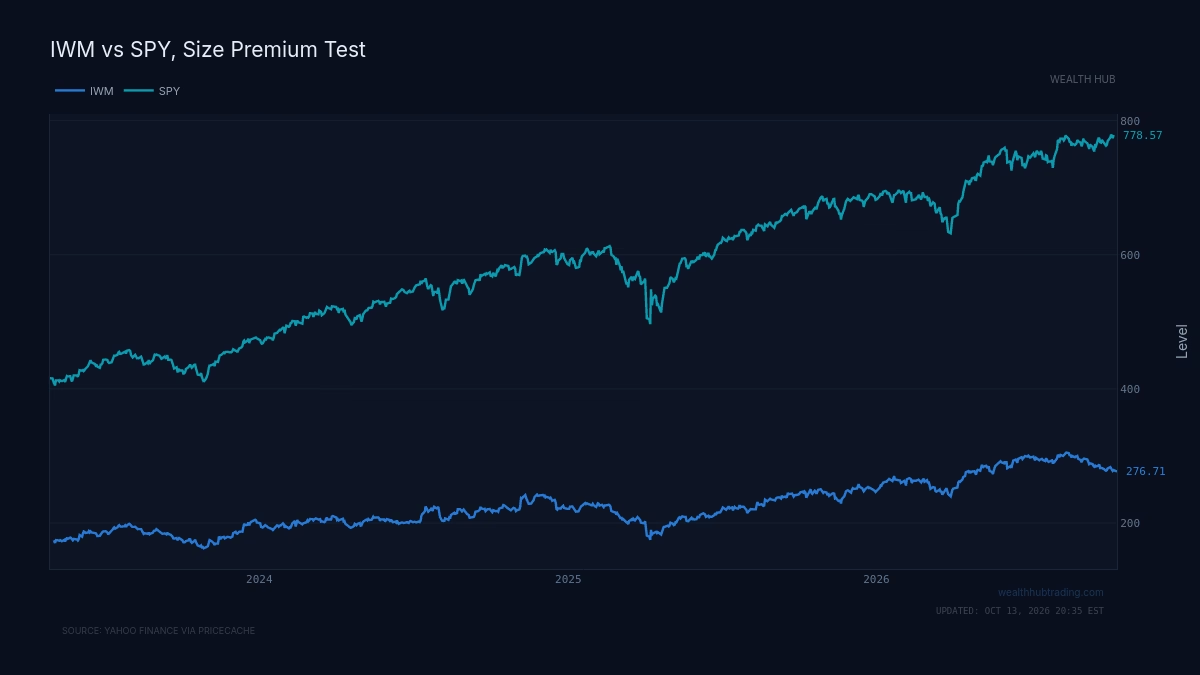
The chart does not prove the size premium is dead. Three years is a short window, and a premium with a long-run expected value can lose for longer than that. It shows something narrower and more useful: the published magnitude was never a reliable forecast, and capital built around it has had to accept long stretches in which the original coefficient did not apply.
Two Readings of the Same Decay
By the 2010s the question had become systematic. In 2016 R. David McLean and Jeffrey Pontiff published "Does Academic Research Destroy Stock Return Predictability?" in the Journal of Finance. They studied 97 return predictors from the academic literature and divided each one's history into three periods: the original sample, the gap between the end of the sample and publication, and the years after publication. They found returns roughly 26% lower in the out-of-sample, pre-publication window and roughly 58% lower after publication. They attributed the difference between those two figures to investors trading on what they had read.
McLean and Pontiff were reasoning from market efficiency in motion. To them, the decay reflected informed capital doing what theory said it should do. Anomalies were real mispricings, and publication was the signal that brought arbitrageurs in. That view flattered both academics, whose discoveries were real, and markets, which corrected them. It also gave practitioners a tidy rule: trade an anomaly early, before the paper comes out.
Muravyev, looking at a much broader population of results, sees the decline arriving at the sample boundary with no clear extra drop at publication. On that view the 26% figure was not a preview of a later arbitrage story. It was most of the story. The coefficient was inflated where it was estimated, and the inflation disappeared as soon as the estimation stopped. The two readings start from the same kind of evidence and assign blame to different actors: one to investors who read the paper, the other to the researcher's search through specifications.
The two studies are not cleanly comparable, and that link deserves an explicit hedge. McLean and Pontiff examined cross-sectional return predictors, the anomalies most open to trading. Muravyev's 1,328 papers cover all of empirical finance, including corporate finance and other results that no arbitrageur could trade away. It is plausible that publication-driven arbitrage matters for tradable anomalies even if it does not show up in the aggregate. What the new study removes is the presumption that arbitrage is the main explanation. When results that cannot be traded decay on the same schedule as results that can, trading is a poor candidate for the common cause.
Three Hundred Factors and a Higher Hurdle
The second instance of the pattern came from researchers who counted. In 2016 Campbell Harvey, Yan Liu, and Heqing Zhu catalogued 316 factors proposed in the literature to explain the cross-section of expected returns. They argued that with so many hypotheses tested on essentially the same stock-return history, the conventional t-statistic of 2.0 was far too low a bar, and that a new factor should clear something closer to 3.0. Their point was arithmetic rather than accusation. Enough researchers searching the same data will find patterns at the conventional significance level by chance.
In 2020 Kewei Hou, Chen Xue, and Lu Zhang published "Replicating Anomalies" in the Review of Financial Studies. They rebuilt 452 anomalies with consistent methods, controlling for the outsized influence of microcaps, and found that up to 65% failed to clear even the conventional threshold. Many published anomalies had depended on the smallest and least investable stocks, the same corner of the market where Banz's size effect had been concentrated.
Muravyev's findings on the strength of original evidence fit this lineage closely. In the weakest quartile of published results, only about 31% kept their sign and significance out of sample after the precision adjustment, and roughly one-third of the original coefficient remained. In the strongest quartile, about 72% held up, with a median coefficient ratio of 0.62. A result that only just cleared the bar in its own sample often did not clear it again. A result that cleared it comfortably kept most of its shape, though it still lost more than a third of its size.
He also tested the obvious explanation directly. Two fitted models of publication selection, the tendency of journals to print significant results and reject the rest, predicted that about 90% of the published coefficient should survive in later data. Actual median retention was 45%. On those models, publication bias accounts for roughly one-fifth of the decay. The remainder points to something closer to the researcher's desk than the editor's: specification choices, sample windows, variable definitions, and the many small decisions that a published table does not show. Model misspecification and genuine changes in the underlying economics may also contribute. The study does not decompose the remaining four-fifths, and no single cause should be presented as settled.
What the Pattern Says About the Present
Across Banz, McLean and Pontiff, the factor catalogues, and now Muravyev, the same sequence recurs. A result is estimated on a fixed history. It is published with a coefficient that becomes an industry constant. Capital is committed on the assumption that the constant carries forward. Then the coefficient comes in at roughly half, and the profession argues about whether markets, investors, or researchers are to blame. Each time, the explanation that most often holds up is the least dramatic one: the original estimate was drawn from a selected sample, and new data is simply less selected.
What differs this time is the cost of checking. Each earlier reckoning took years of skilled labor. McLean and Pontiff assembled 97 predictors by hand. Hou, Xue, and Zhang spent years standardizing 452. Muravyev's pipeline rebuilt 1,328 papers and audited every one. Once replication is that cheap, the out-of-sample test no longer needs to wait a decade for someone to commission it. It can run continuously as new data arrives, on any published claim with accessible inputs. The incentive that sustained the inflation, a large return to discovery and a small chance of rapid verification, is weakening.
For anyone who uses academic estimates as inputs, the practical reading is specific. A published coefficient is an upper bound shaped by its sample, not a central forecast. Halving it is not conservative; on this evidence it is roughly the median outcome. The t-statistic in the original paper deserves more weight than the effect size, because evidential strength predicts durability far better than the size of the reported effect. A premium backed by a t-statistic near 2.0 should be treated as provisional until it has survived data its author did not see. Results that have already passed that test, across several market environments, carry information that no single estimate can.
The structural point concerns timing rather than any particular figure. When a pattern weakens at the date its data ended, the weakness was built into the estimate from the start. Investors who wait for publication to tell them when an edge has been arbitraged away are often watching the wrong date.