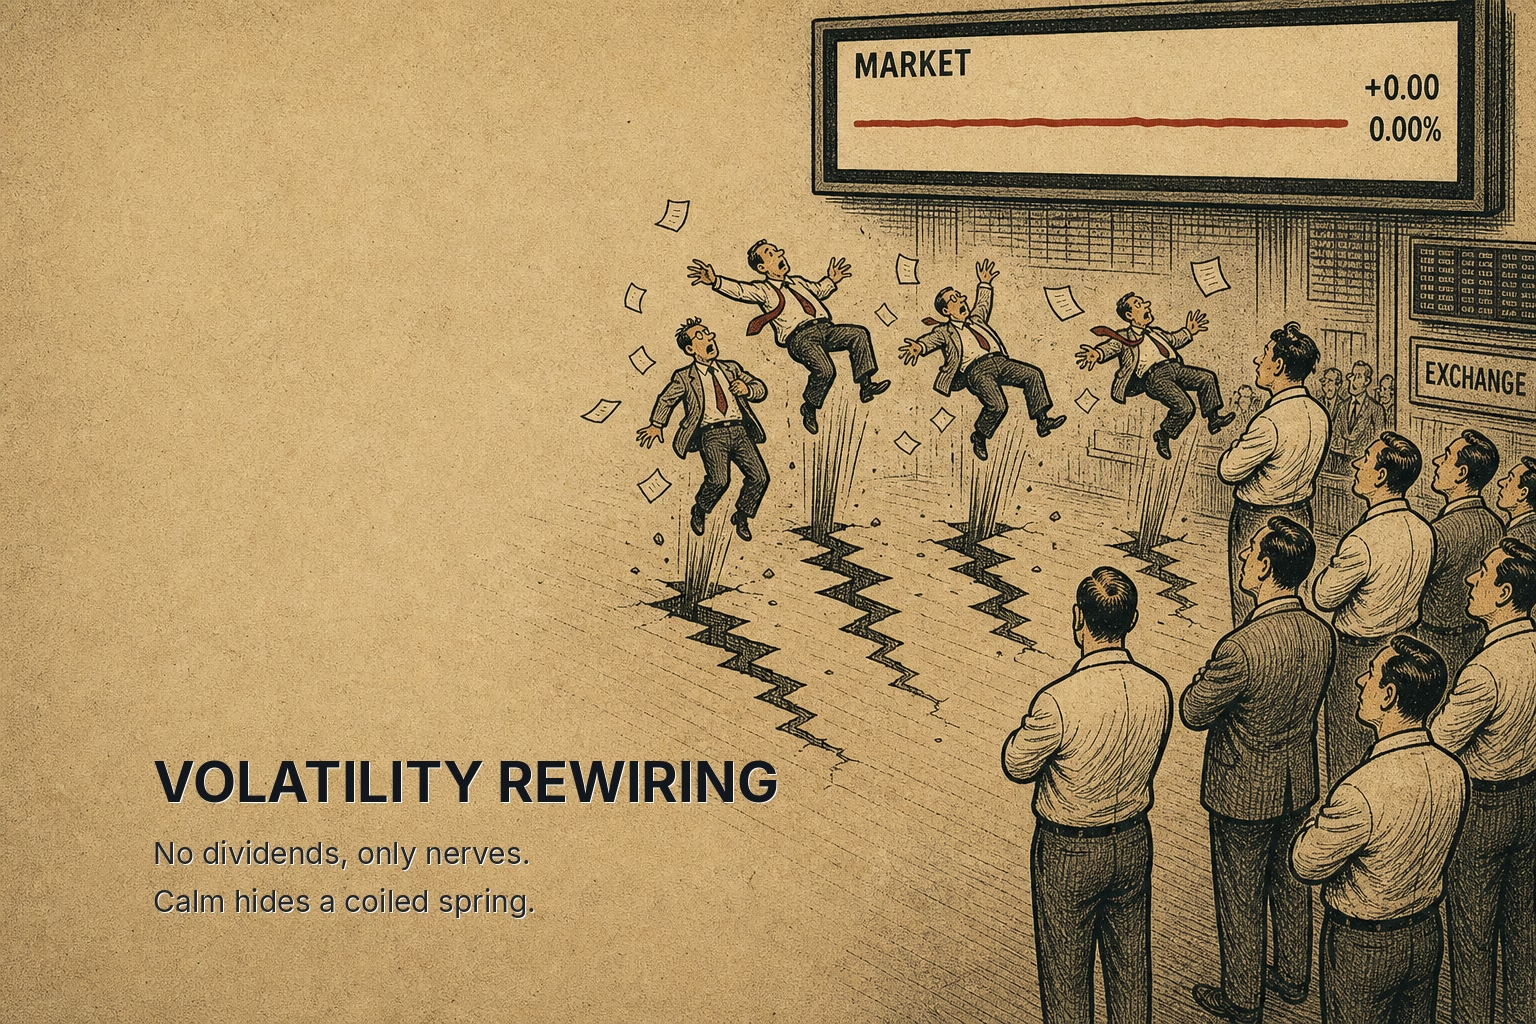
The danger in Michael Burry's latest Foundations piece is not a crash. It is a calendar. The bear market his history points toward does not need to fall far to ruin a generation's arithmetic. It only needs to last, and the market has spent fifteen years training itself to believe that bear markets are short.
A caldera is a useful image for this, and it is in the title for a reason. A caldera is not the summit of a volcano. It is the crater left behind when the chamber underneath empties and the ground slowly settles into the void. The surface can look calm for a long time while the support beneath it drains away. When the collapse comes, there is no single dramatic instant to point at. There is only ground that sits lower than it used to and stays there.
That is the shape of the three great real bear markets in American equities. It is also the shape the current market is least prepared for.
What Did October 6th Actually Say?
Very little, and that is the point. The S&P 500 closed at a record on October 6, 2026. Burry describes it fairly: a trending new high on no significant volume, the kind that usually produces some mild consolidation, a frightening day or two, and then a resumption of the trend. He sets it beside the highs of June 2 and August 13, 2026. Each of those consolidated briefly before the cavalry arrived for another record.
The bulls are right about one thing. Trending highs on quiet volume are not, by themselves, a top signal. Markets that are about to break usually announce it with stress: widening spreads, ugly breadth, failed rallies on heavy volume. None of that sits in the October 6th print. If the question is whether the next few weeks look like June and August, the honest answer is that they easily could.
The part consensus misses is that Burry is not playing that game, and he says so. Technical pattern-reading belongs to the pod shops and the algorithms, and they are very good at it. His argument runs on a different clock. A quiet record high tells you almost nothing about the next month. It tells you a fair amount about where the starting line sits for the next fifteen years.

The record is the reigning champion. Champions are measured by how long they hold the title, not by how they won it.
How Long Is a Bear Market?
Ask a trader and the answer comes in months. Ask the historical record and it comes in decades.
Burry lays out three episodes, computed from Robert Shiller's monthly data deflated by Bureau of Labor Statistics CPI. From 1966 to 1982, the inflation-adjusted price of the S&P 500 fell about 53% on annual averages, excluding dividends. From 1929 to 1949, spanning the Depression and a great deflation, the real price return was negative 58%. From the 2000 top to the 2011 trough, it was roughly negative 40%. These are not crashes in the colloquial sense. They are sixteen years, twenty years, and eleven years of capital standing still or sliding backward in real terms.
His father, a man in his early thirties in 1980, told him that nobody ever made money in stocks. For someone who turned 18 in 1966, that was not cynicism. It was an accurate description of his entire adult life as an observer of the market. Burry's own reading of the stock tables began with American Motors moving from $2 5/8 to $4 1/4, a nominal gain inside a real-terms desert. Both things were true at once, which is exactly how long bear markets disguise themselves.
The recent analog people reach for is 2022. The Fed ran its fastest tightening in four decades, CPI peaked at 9.1%, and equities fell roughly 20% for the year. Then the market recovered and pressed on to new highs. That episode is the source of a great deal of today's confidence.
It is also the wrong lesson. The 2022 drawdown was sharp and short, and the market learned from it that inflation shocks are survivable within a year or two. Every one of the three long real bear markets began with a period that looked, at first, like something survivable. The 1966 high was followed by a recovery to new nominal highs in the early 1970s. The 2000 top was followed by a nominal recovery into 2007. The damage was not in the first leg down. It was in the decade of inflation and multiple compression that ate the recoveries from underneath.
The drawdown is the event. The duration is the loss.
Where Did the Cushion Go?
This is the disclosure buried in Burry's own footnote, and it is the one the market is not pricing.
He notes that dividends transform the three episodes. With dividends reinvested, the 1966 to 1982 real loss shrinks from about 53% to roughly 10%. The 2000 to 2011 loss shrinks from roughly 40% to roughly 25%. A holder who reinvested from 1929 was ahead in real terms by 1949. Read quickly, that sounds like reassurance: the patient, reinvesting holder always came through.
Read slowly, it is an indictment of the present. The cushion that rescued the 1966 holder was built from dividend yields running several times what the S&P 500 pays today. The 2000 episode, which began from a thin yield much like the current one, is the case where reinvestment rescued the least: the real loss was still a quarter of capital after eleven years of patience. The pattern across the three episodes is worth stating plainly. The higher the starting yield, the more of the real price loss the dividend absorbed. The lower the starting yield, the more of the loss the holder simply ate.
The market today starts from the thin end. A broad index priced for perpetual growth pays the holder very little to wait. If the next long bear looks like 1966 in its price path, it will not look like 1966 in its total return, because the compounding engine that turned a 53% price loss into a 10% total loss is running at a fraction of the old horsepower.
Burry adds a second, more human qualification, and it deserves more weight than he gives it in the free portion. Textbook returns assume dividends reinvested and compounded without interruption across fifteen or twenty years. Real holders retire, draw income, sell in a panic, rebalance into the wrong thing, and pay tax along the way. The life stage of the investor determines how much of the theoretical cushion they ever collect. A 60-year-old in 2026 does not have a twenty-year runway to wait out a 1929-to-1949 path. The mathematics of patience assume a patience most portfolios cannot afford.
Inflation is the hinge, and here the macro channel does real work in the argument. All three long real bear markets were defined in real terms, and two of them, 1966 to 1982 and 2000 to 2011, saw nominal prices hold up far better than real prices did. Burry writes that inflation is rearing its head again. If that is right, the market can post nominal records and still be well into a real decline, the caldera settling under a surface that reads, on the quote screen, as a new high. Precise current inflation figures are not summarized here. The direction is the part that matters for this argument, and on direction Burry is unambiguous.
A thin dividend makes a long wait a real loss.
Who Breaks First?
The subtitle of Burry's study is a detailed comparison of leaders versus broken stocks and what market breadth implies for performance in the next bear market. The findings sit behind his paywall, so what follows is our read of the setup, not a summary of his conclusions.
The consensus model of a bear market runs as follows: the speculative junk falls first and hardest, the quality leaders hold up, and investors rotate into the giants for safety. That is how 2000 to 2002 is remembered, and it is half right. The profitless speculation was annihilated. The part consensus misses is that the index-level loss of that era was driven by the leaders, because the leaders were the index. Cisco, the picks-and-shovels supplier to an expansive vision of the networked future, fell 86% from its 2000 high. It was not a broken stock in 1999. It was the most admired company in America.
A narrow market inverts the safety logic. When a handful of names carry most of the index's gains, the broken stocks have already done their breaking. They have little left to lose in index terms. The leaders carry all the weight and therefore carry all the remaining downside. The record high on October 6th is a statement about the leaders, and breadth beneath them is the measure of how much of the market has already quietly settled into the caldera.
This is where the potential beneficiaries usually listed for a soft-landing tape, NVDA, AMD, SMCI and MSFT, with the semiconductor index as the benchmark, become the most exposed rather than the most protected. Burry's prior piece argued that the tech giants, Apple excepted, are spending as if their lives depended on it when their lives clearly do not. Capital spending on that scale flows directly into the revenue of the chip suppliers. If the spending slows, the leaders' customers and the leaders' suppliers reprice together, and they reprice the index with them. We should be clear that this link is an inference from the structure of index weights and customer concentration, not a finding from his study.
There is a second sorting that a long bear market performs, and it is visible in the software layer. Among the large cybersecurity names, Check Point's FY2025 results show a 30.5% operating margin and $1.2 billion of free cash flow on $2.7 billion of revenue. Fortinet's FY2025 results show a 30.6% operating margin and $2.2 billion of free cash flow on $6.8 billion of revenue. CrowdStrike's FY2026 results show $1.3 billion of free cash flow on $4.8 billion of revenue alongside a negative 6.1% GAAP operating margin, and SentinelOne's FY2026 10-K shows a negative 30.9% operating margin on $1.0 billion of revenue while its cash flow statement reports $75.9 million of free cash flow. These names are not part of Burry's study and we use them only as an illustration. Two of the four earn money under generally accepted accounting. Two report healthy cash flow while losing money on the income statement, with non-cash charges bridging the gap. In a market that pays for growth, those two profiles trade as near equivalents. In a long real bear market that pays for earnings quality, they diverge, because a cash flow that exists only before certain costs is the first thing a skeptical buyer discounts.
Burry has spent several posts on earnings quality and unrecognized cyclicality. The next bear market is where that work stops being an argument and becomes a price.

What Is the Patient Holder Actually Promised?
Positioning, by available consensus data, is crowded long risk on a soft-landing base case, with markets priced for a coordinated recovery. "Stonks go UP!" and BTFD are the mantras, and anyone who calls the market overvalued is met with a meme. Burry himself frames the stake as a question: if another 15 to 20 years of negative or minimal real returns is coming, would it not be good to know?
We cannot assign that outcome a confident probability, and nobody honestly can. The most likely path is the unsatisfying one. Macro regimes shift slowly, almost invisibly, until the shift is obvious and fully priced. A faster transition is a real possibility. The outcome in which the regime simply stabilizes and the trend resumes uninterrupted is the minority case, and it is the one the market has adopted as its default. The asymmetry is plain enough. The holder priced for the stable outcome is unhedged against both of the others.
What history does promise is narrower than the bulls claim and gentler than the doom-mongers claim. Through all three real bear markets, the patient holder faced a very long wait rather than a wipeout. Burry is precise about this, and the precision is the warning. A wipeout is a risk most investors at least imagine. A twenty-year wait is a risk almost nobody imagines, because no one under 40 has lived through one in nominal terms, and the investors who lived through 2000 to 2011 have been rewarded so handsomely since 2011 that the memory has been paid off.
The practical consequence falls on whoever holds the index at the current weights, with the current yield, at the current stage of life. The leaders carry the index. The thin dividend leaves little to cushion the wait. The investor's own timeline sets how long the wait can be survived. Each of those three is worse today than at the start of the 1966 episode, and only the first one shows up on a quote screen.
Burry's father was not wrong. He was early, and then he was late, and the market was flat in real terms the whole time he was right.
The ground under a record high can sink for twenty years without ever making a sound.