The $3.8 billion that moved one line down
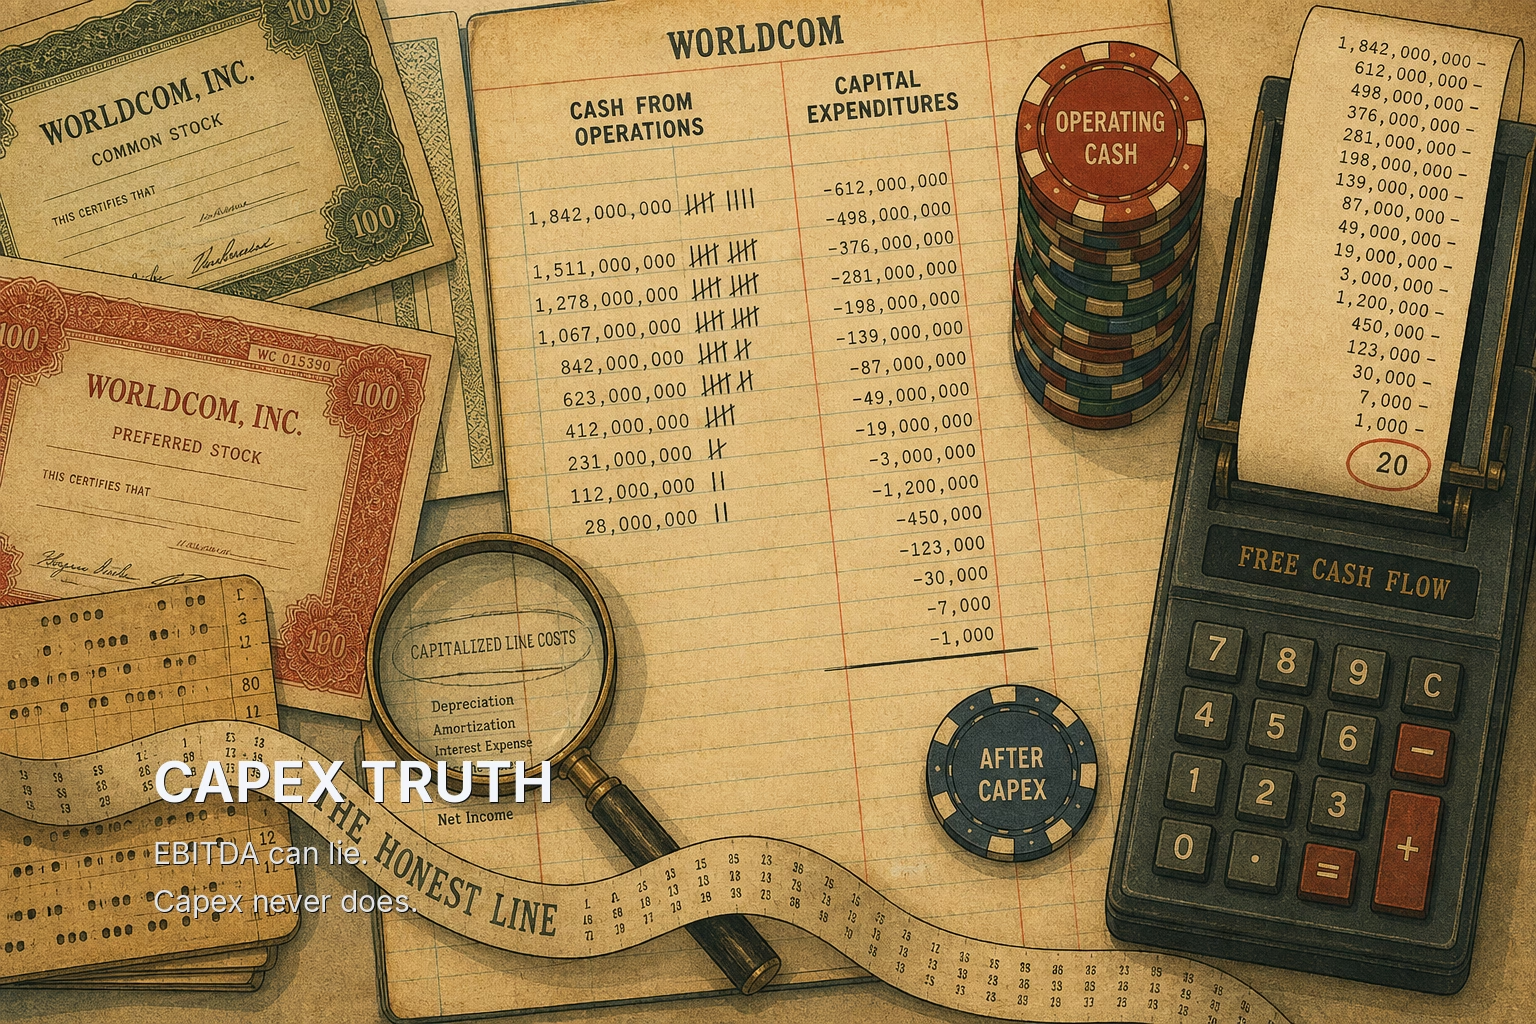
WorldCom's operating cash flow looked healthy right up until the company collapsed. That is the detail most retellings skip. In June 2002 the company disclosed that it had booked roughly $3.8 billion of line costs as capital expenditures across five quarters. Line costs are the fees one telecom carrier pays another to carry its traffic, and they had been recorded as investments rather than expenses. The total misstatement later grew to about $11 billion. The company filed for bankruptcy in July 2002, the largest US filing on record at the time.
The trick was mechanically simple. An ordinary operating cost was relabeled as an asset purchase. An expense hits the income statement immediately. A capital expenditure, or capex, sits on the balance sheet and is depreciated slowly over years. Moving the cost pushed EBITDA (earnings before interest, taxes, depreciation and amortization) up by the full amount, because the cost left operating expenses and reappeared as future depreciation, which EBITDA excludes by construction.
The second effect is the one that should change how you read filings. The cash statement has three sections: operating, investing and financing. Capex lives in investing. So the same relabeling that inflated EBITDA also pushed the cash out of the operating section and into the investing section, which inflated operating cash flow. Two headline metrics that analysts treat as independent checks were corrupted by a single entry.
Only one number stayed honest: operating cash flow minus capital spending. The cash paid to other carriers still left the building. It just exited through a different door. Anyone who subtracted the investing outflow from the operating inflow saw a business generating far less cash than either headline implied. The practical lesson is blunt: no single line on a cash-flow statement is trustworthy alone, and the subtraction is where manipulation runs out of room.
Why EBITDA and cash drift apart
EBITDA is earnings before the bad stuff. It strips out interest, which is real cash paid to lenders. It strips out taxes, which are real cash paid to governments. It strips out depreciation, which is the accounting echo of real cash already spent on equipment that wears out. What remains is a measure of operating profit before the business pays for its capital structure, its tax bill, or the machines that produce the revenue.
Even if every number is reported honestly, EBITDA records revenue when it is earned rather than when it is collected. That timing gap is called an accrual. When a company ships product on 90-day terms, it books revenue and EBITDA today, but the cash arrives next quarter. The unpaid amount sits on the balance sheet as accounts receivable. Inventory works the same way in reverse: cash spent building stock leaves the bank before the cost of those goods ever reaches the income statement.
The cash-flow statement exists to undo these timing differences. It starts from net income, adds back non-cash charges, and then adjusts for changes in working capital, the short-term assets and liabilities (receivables, inventory, payables) that tie up or release cash. A rise in receivables is subtracted because it represents revenue not yet collected. A rise in payables is added because it represents bills not yet paid.
One divergent year means little. Businesses grow, seasons shift, a large customer pays late. Consecutive years of EBITDA running well ahead of cash are a different finding, because the accruals are then doing the earning. Receivables that grow faster than sales for three years running are not a timing quirk. They are a claim on customers that may never be fully collected. When you see the gap persist, read the working-capital lines before you read the earnings release.
A worked example of the gap
Consider a hypothetical industrial distributor reporting $500 million of EBITDA. Management highlights it in the press release, lenders test covenants against it, and the stock trades on a multiple of it. Now trace the cash.
Start with EBITDA of $500 million. Subtract $60 million of cash interest and $40 million of cash taxes. Receivables rose by $120 million because the company extended longer terms to win business. Inventory rose by $50 million. Payables rose by $30 million because the company stretched its suppliers.
Operating cash flow = 500 - 60 - 40 - 120 - 50 + 30 = $260 million
Next, estimate maintenance capex, the spending required simply to keep existing capacity running, as distinct from growth capex that adds new capacity. Companies rarely disclose the split, so a common starting proxy is the depreciation charge. Assume depreciation of $150 million.
Owner cash flow = 260 - 150 = $110 million
The business that advertised $500 million of EBITDA threw off $110 million of cash available to owners. Cash conversion, owner cash divided by EBITDA, is 22%. If the stock trades at 10 times EBITDA, a $5 billion enterprise value, the buyer is paying roughly 45 times the cash the business actually produced.
Notice where the gap came from. Interest and taxes are unavoidable and visible. The damaging lines are receivables and inventory, which together absorbed $170 million, more than a third of EBITDA. The $30 million from stretched payables flattered the result further, because suppliers cannot be stretched indefinitely. Run this subtraction on any company you own, and if conversion sits below 50% for consecutive years, you need an explanation from the filings rather than from the earnings call.
The economic mechanism behind the reversal
Accruals reverse because every accrual is a promise that has to be settled in cash eventually. A receivable becomes cash only when the customer pays. If the customer was given unusually generous terms to pull a sale forward, or was a weak credit to begin with, the receivable is eventually written down and the earnings it supported disappear. Inventory becomes cash only when it sells. Unsold or obsolete stock gets marked down, and the markdown flows straight through the income statement. Capitalized costs, WorldCom's line costs included, become depreciation or impairments in later years.
The actors who create persistent accruals usually respond to incentives tied to the headline number. Executives whose bonuses key off adjusted EBITDA have a reason to pull revenue forward. Borrowers whose loan covenants cap debt at a multiple of EBITDA have a reason to keep EBITDA high near a test date. Sales teams with quarterly quotas offer extended terms in the final weeks of a quarter. None of this requires fraud. It only requires that the reported number be the thing everyone is paid on.
Academic work supports the reversal pattern. Richard Sloan's 1996 study in The Accounting Review found that companies whose earnings were made up heavily of accruals tended to see those earnings fall in subsequent years, and their stocks tended to underperform companies with earnings backed by cash. This is a tendency, not a law, and the effect has weakened in some later periods as more analysts learned to look for it.
Today's version of the problem often lives in the operating section itself. Supplier finance programs, in which a bank pays a company's suppliers early and the company repays the bank later, can make payables look like ordinary trade credit and lift operating cash flow. US accounting rules now require companies to disclose the size of these programs in fiscal years beginning after December 15, 2022. Receivables factoring, selling receivables to a third party for immediate cash, works the opposite side of the same ledger. Both disclosures appear in footnotes, not headlines, and footnotes are where the unpriced information tends to sit. When operating cash flow improves suddenly, check whether a financing arrangement is doing the work before crediting the business.
When the subtraction misleads
The owner-cash framework has real failure modes, and the largest one is the split between maintenance and growth capex. A company building new capacity will show capital spending far above depreciation, and owner cash flow computed with total capex will look terrible even if the investment earns excellent returns. Subtracting only depreciation flatters a company whose assets are wearing out faster than the accounting schedule assumes.
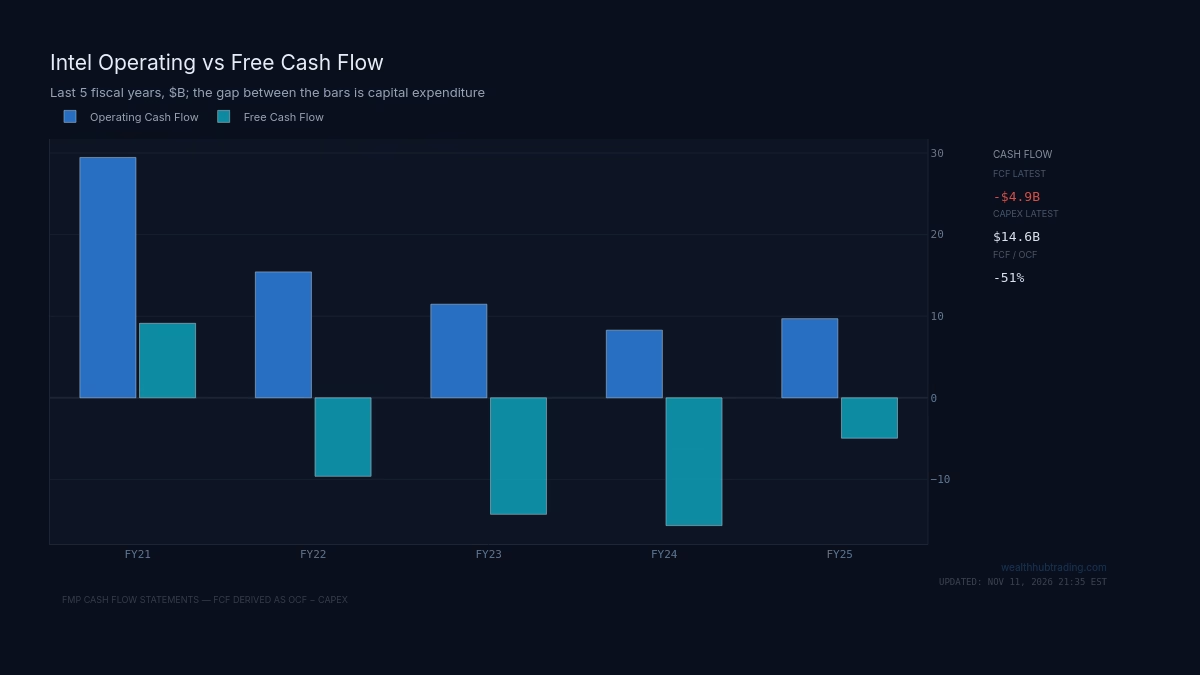
Intel is a useful current illustration. Its recent annual filings show capital spending running well above operating cash flow as it built new chip fabrication plants, pushing free cash flow deeply negative. Treating that entire gap as maintenance would badly misstate the economics, because much of it was a deliberate expansion bet. The fair question is not whether cash was negative but whether the new capacity will earn its cost of capital, which the cash statement cannot answer alone.
Depreciation as a proxy also breaks during inflation. Depreciation is based on what assets cost when they were bought, while replacing them costs today's prices. A trucking fleet bought five years ago at lower prices will cost more to replace, so true maintenance capex runs above the depreciation line.
Two other traps deserve mention. Stock-based compensation is added back in operating cash flow because no cash leaves the company, but employees are paid in shares that dilute owners, so the cost is real even when it is invisible in the cash statement. And young companies growing fast will naturally build receivables and inventory ahead of revenue, which is a legitimate accrual gap rather than a warning. Before you condemn a divergence, identify which type of capex and which type of working-capital build you are looking at, and adjust the subtraction accordingly.
Reading the statement in the right order
WorldCom showed that a single relabeling can corrupt both EBITDA and operating cash flow together, while the subtraction of capex from operating cash catches it. The general version: EBITDA measures profit before capital costs, operating cash flow measures profit after timing differences, and only operating cash minus maintenance capex measures what owners can actually take out.
So read a filing in this order. Start with the cash-flow statement rather than the income statement. Compare receivables growth to revenue growth across three years. Find the supplier finance and factoring footnotes. Estimate maintenance capex from depreciation, adjusted for inflation and for any disclosed growth projects. Then compute cash conversion against EBITDA. A company that converts above 70% for consecutive years has earnings you can lean on. A company that converts below 40% for consecutive years is reporting accruals, and accruals eventually come due in cash or in write-downs.