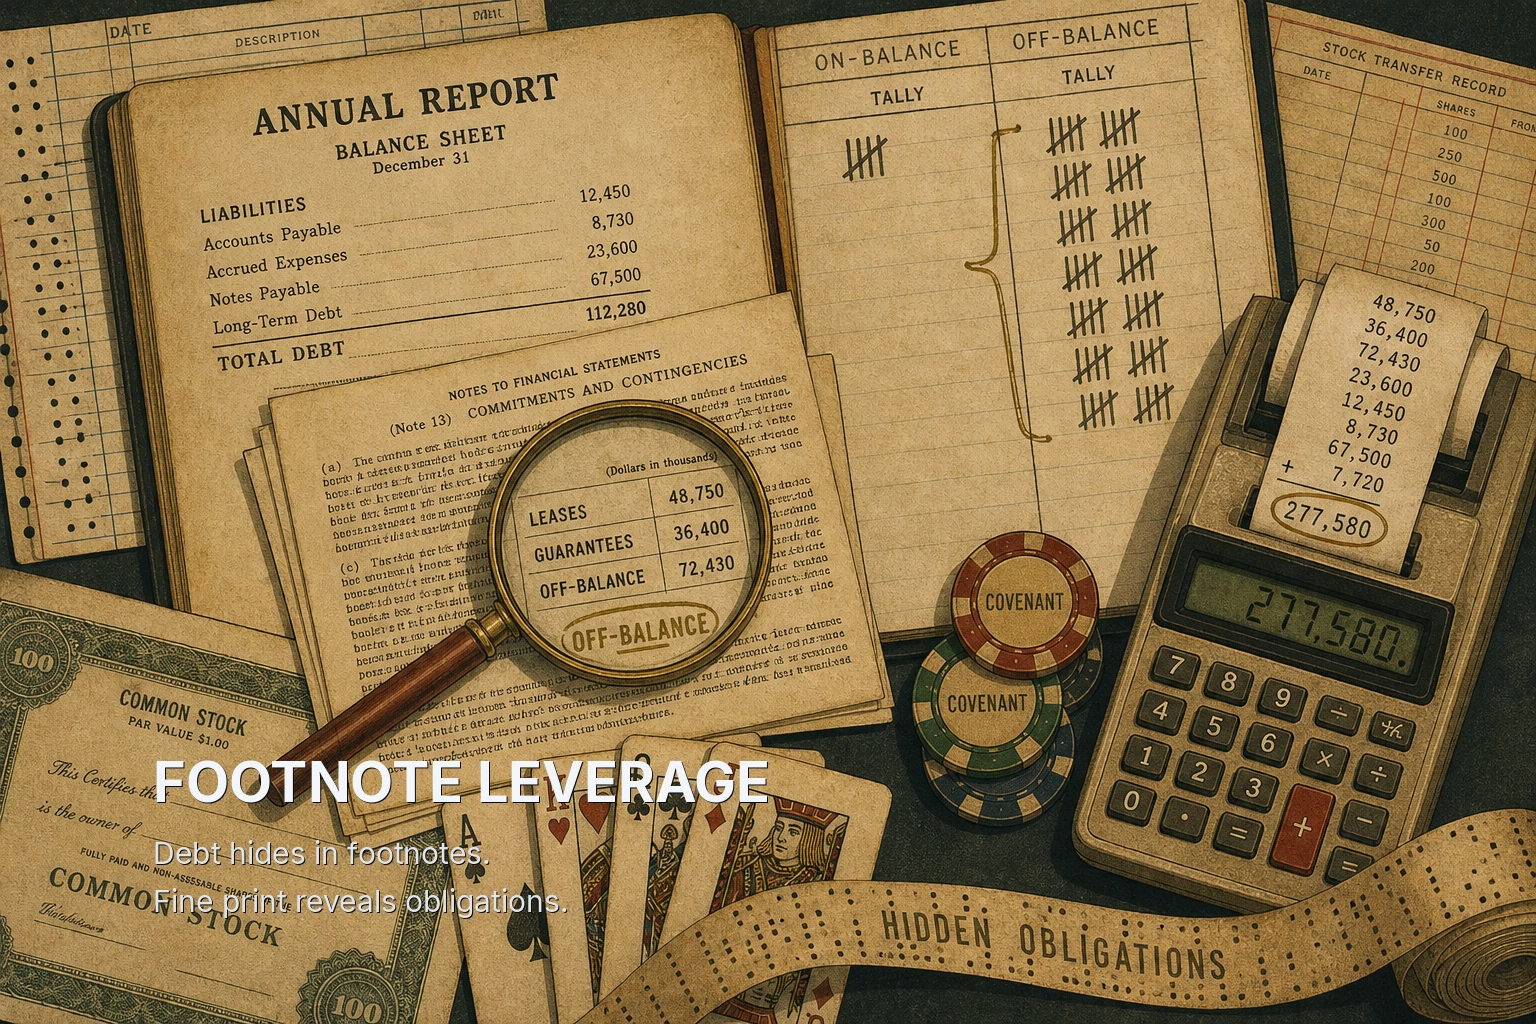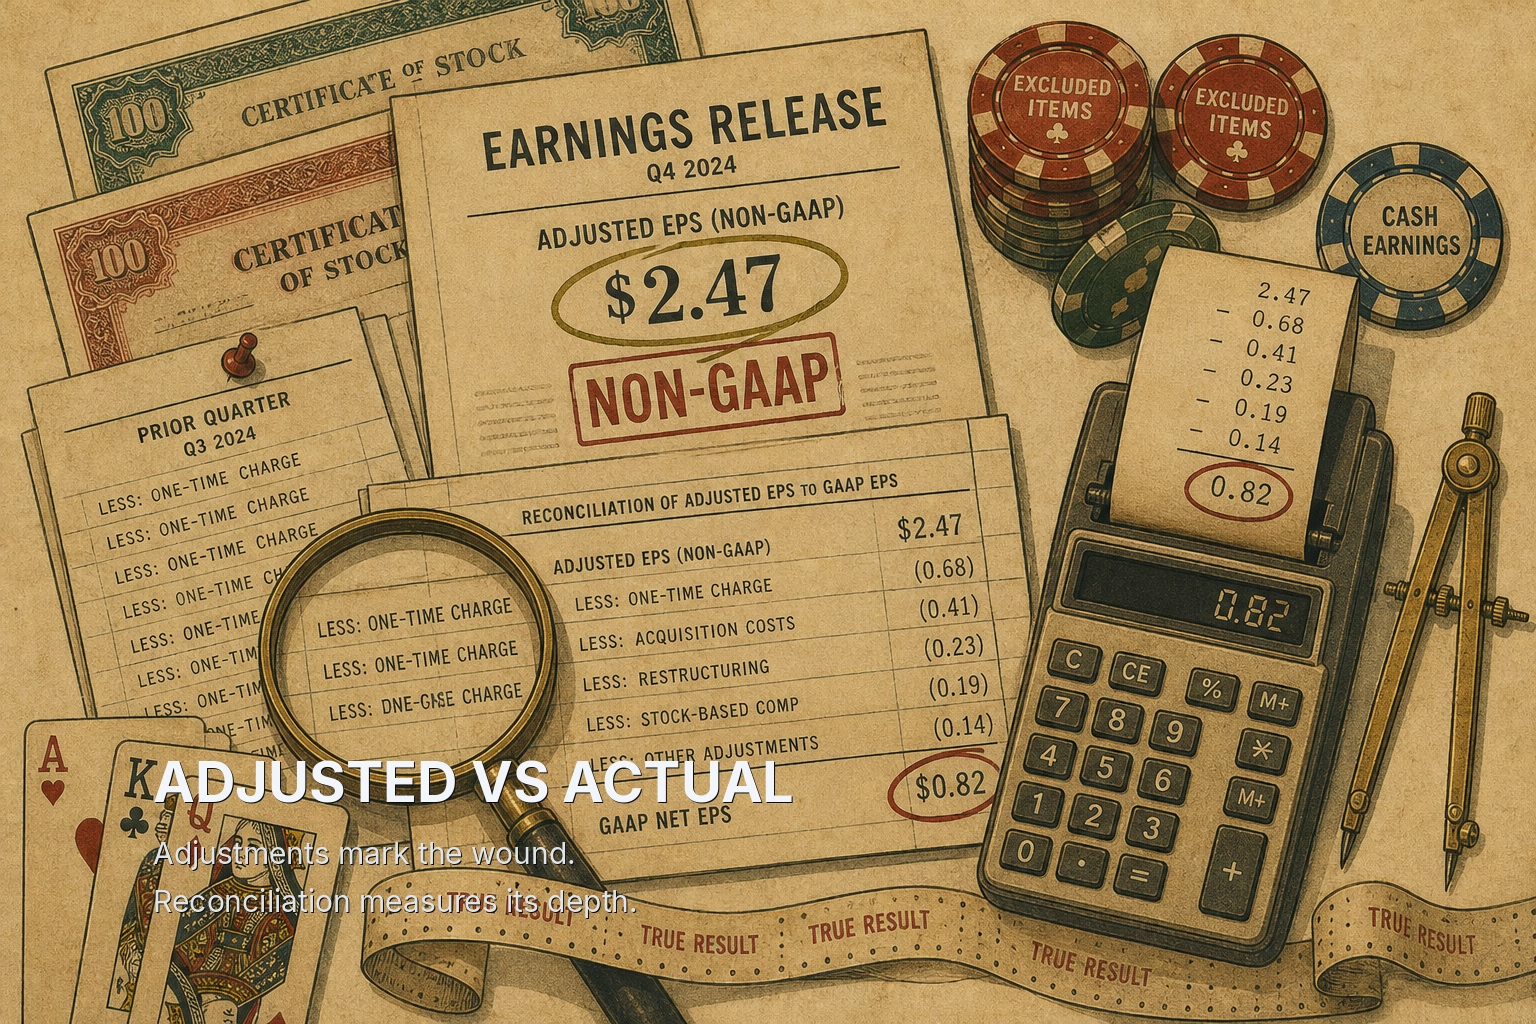
When a company's numbers are deteriorating, the most useful page in its filing is often the one management most wants you to skip: the table that converts its preferred metric back into the accounting rules everyone else uses. The press release sells the story. The reconciliation discloses the cost. The market prices the first and frequently ignores the second until the gap becomes too wide to ignore.
WeWork's metric that measured nothing
In August 2019, WeWork's parent filed its IPO prospectus and introduced the investing public to community-adjusted EBITDA. EBITDA, earnings before interest, taxes, depreciation and amortization, is already a generous measure because it ignores the cost of financing and the wear on physical assets. WeWork's version went further. It stripped out building and community operating costs, including rent, the single largest expense in a business that leases offices and subleases desks.
The prospectus showed a company that lost roughly $1.9 billion in 2018 on about $1.8 billion of revenue. Its headline metric framed that business as one whose underlying units were profitable. The reconciliation was in the filing for anyone to read. Within weeks the IPO was pulled, the founder stepped down, and private valuations that had reached $47 billion collapsed.
The lesson is not that WeWork lied. The numbers were disclosed. The language had simply been built to direct attention away from them, and the reconciliation table showed exactly how much work the adjustments were doing. For you, the takeaway is concrete: when a new metric appears that no peer uses, read its reconciliation before you read anything else.
Why language inflates as the numbers fall
Why does this happen so predictably? Because the people who write the language face incentives that strengthen precisely as performance weakens.
Start with the actors. Executive compensation is frequently tied to adjusted metrics rather than GAAP results. GAAP, generally accepted accounting principles, is the standardized rulebook every US-listed company must follow. When bonuses depend on adjusted operating income, every charge that can be classified as "non-recurring" protects pay. Debt covenants, the financial tests lenders write into loan agreements, are often defined on adjusted EBITDA as well. A company near a covenant limit has a direct financial reason to widen what counts as an add-back.
Then there are analysts and their consensus estimates. Sell-side models often anchor to the company's own adjusted figures, so a "beat" is measured against a number management partly defines. That creates a feedback loop. Management guides to an adjusted number, the street models it, the company meets it, and the headline reads as stability.
The regulatory backstop is real but narrow. Since Regulation G took effect in 2003, US companies must reconcile any non-GAAP measure to the closest GAAP equivalent, and the SEC tightened its guidance on misleading adjustments in 2016. The rules force disclosure. They do not force prominence. The reconciliation can sit on page 14 while the adjusted figure leads the headline.
The mechanism, then, is this: deteriorating results raise the private value of favorable framing for management, lenders' tests and compensation committees, while the disclosure rules guarantee the unflattering version still exists somewhere in the document. That combination is what makes the gap tradeable. What this means for you is that the reconciliation is not boilerplate; it is the mandated confession attached to every flattering number.
Three ways the language bends
Language inflation tends to show up in three recognizable forms, and each leaves a trace you can measure.
Adjusted metrics multiply. A healthy company may report one non-GAAP figure. A struggling one adds adjusted EBITDA, adjusted operating margin, adjusted free cash flow, and a segment-level "contribution" measure. Each new metric creates another place to move costs out of view.
One-time items recur. Restructuring charges, impairments and "transformation costs" are excluded as non-recurring. When the same category appears in eight of the last ten quarters, it is an operating cost with a different label.
Definitions shift mid-stream. The company changes how it calculates a metric, often with a footnote and a restated prior period. The new definition almost always produces a better number than the old one would have.
Here is a worked example with illustrative figures. Suppose a company reports adjusted EBITDA of $500 million. Its GAAP operating income is $120 million, and depreciation and amortization total $180 million. Unadjusted EBITDA is therefore $120 million plus $180 million, or $300 million. The remaining $200 million of the adjusted figure comes entirely from management's add-backs.
A simple ratio captures that dependence:
Adjustment share = (Adjusted EBITDA − Unadjusted EBITDA) / Adjusted EBITDA
Here, ($500M − $300M) / $500M = 0.40, so 40% of the headline figure exists only because of management's choices. Now suppose the prior year showed adjusted EBITDA of $520 million on unadjusted EBITDA of $430 million: ($520M − $430M) / $520M ≈ 0.17. The headline fell 4%. The adjustment share more than doubled. The press release reports a modest decline. The filing reports a business whose underlying earnings fell by about 30%.
That second calculation is the one to run. Compute the adjustment share every quarter, and count how many quarters a "one-time" category has appeared. Rising adjustment share alongside a stable headline is the divergence.
Intel's two free cash flows
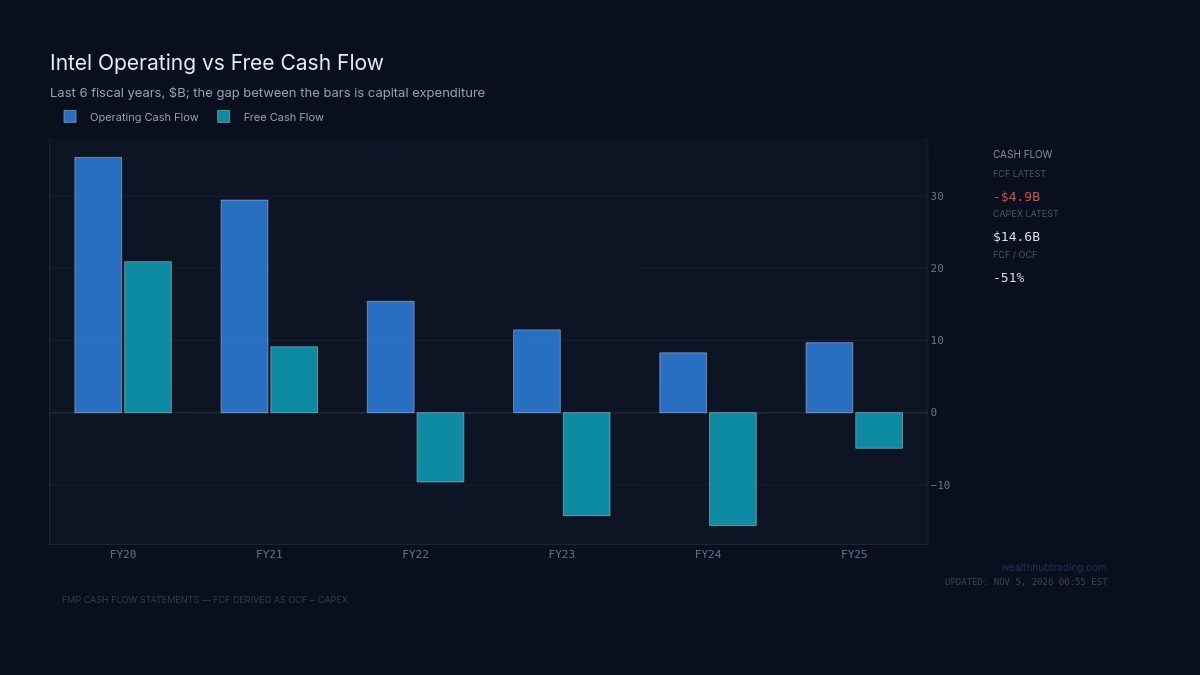
Intel offers a present-day illustration of the definitional shift. Its annual cash-flow statements show operating cash flow remaining positive from 2022 through 2024 while capital spending on new fabrication plants pushed free cash flow below zero. Free cash flow is operating cash flow minus capital expenditure, the cash left after maintaining and expanding the asset base.
During that stretch, Intel also presented an adjusted free cash flow measure that incorporated contributions from partners co-investing in its factory projects. The rationale has economic logic: partners fund part of the build, so the company's own cash burden is lower. The effect, though, was a second free cash flow figure that looked materially better than the standard one, introduced during the period when the standard one was deteriorating.
That does not make the adjusted figure wrong. It makes it a claim requiring scrutiny. Partner capital is not free; it typically buys a share of future output or profits, which the adjusted measure does not deduct. The chart shows the gap between operating and free cash flow, which is capex. The question for you is whether the reported adjustments are narrowing that gap in substance or only in presentation.
When the divergence misleads
The framework fails in identifiable ways, and you should know them before trading on it.
First, some adjustments are genuinely informative. A company that sells a division will carry one-off gains and losses that obscure the remaining business. Stripping those out improves the signal. The test is recurrence and direction: legitimate adjustments appear irregularly and cut both ways, while flattering ones recur and nearly always lift the number.
Second, rising adjustments can coincide with real improvement. A restructuring that closes unprofitable plants generates large charges in exactly the quarters that set up recovery. If you short every company with heavy restructuring add-backs, you will be short some genuine turnarounds at their low.
Third, timing is unreliable. GE's power and insurance problems were visible in its filings for years before the October 2018 dividend cut to a penny, and the SEC later reached a $200 million settlement with the company over its disclosures in those businesses. An investor who identified the language divergence early still had to survive a long stretch where the market ignored it. Disclosure divergence often tells you direction before it tells you timing.
What this means for you: treat the divergence as a filter that identifies where to dig, not as a standalone trigger.
Trading the gap, not the prose
The practical method is mechanical. Ignore adjectives such as "resilient," "disciplined," and "transformational." Instead, track three numbers each quarter: the adjustment share, the count of recurring "one-time" categories, and any definitional change flagged in the footnotes. When those rise while the headline holds steady, the market is pricing the prose. When a catalyst forces the market to price the reconciliation, often a guidance cut, a covenant amendment, or a dividend decision, the gap closes, and usually toward the GAAP figure.
Language inflates when numbers deteriorate because the incentives to frame strengthen while the rules still force disclosure. The reconciliation table is where those two forces meet, and it is the page worth reading first.