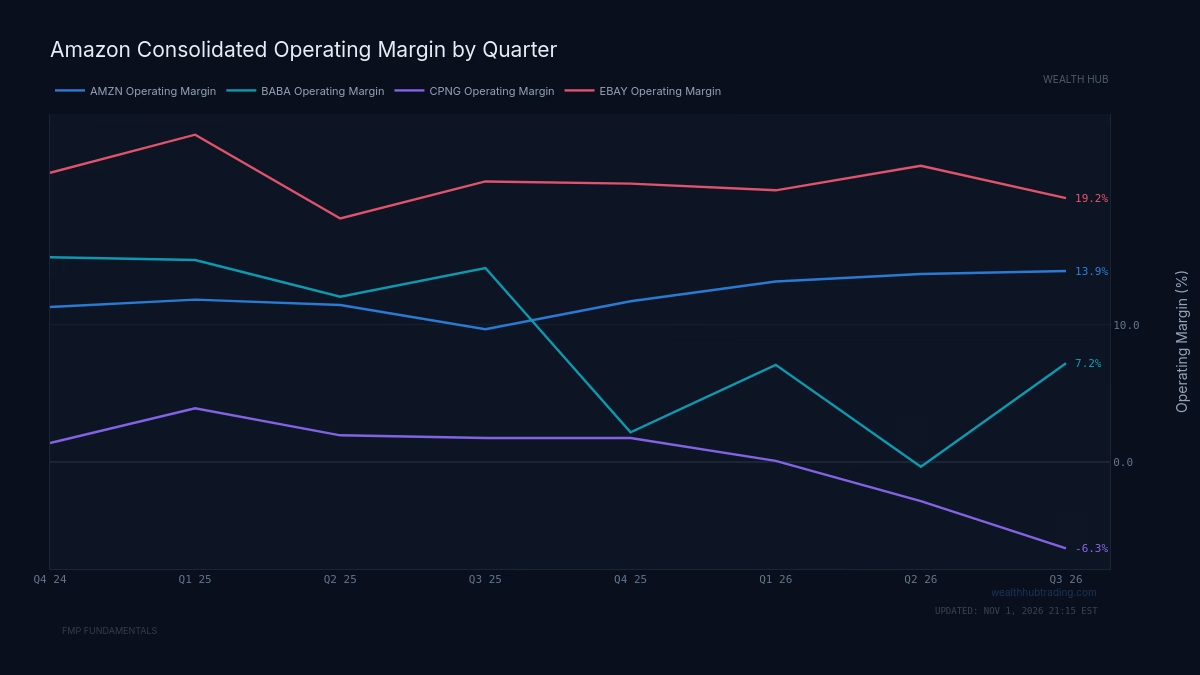
The most valuable disclosure in a 10-K is often buried in a note that most readers skip. For years, Amazon's consolidated profit was smaller than the profit of a single one of its segments. That meant the rest of the company, taken together, lost money. Anyone reading only the headline operating income was valuing a business that, on the filings, did not exist.
The year one segment earned more than the whole company
Amazon began reporting Amazon Web Services as a separate segment in its first-quarter 2015 results. Until then, cloud revenue sat inside an "other" line, and the market treated Amazon as a thin-margin retailer that reinvested everything. The breakout showed something different. The cloud business was already profitable at a margin that retail could not approach, and the shares jumped sharply the day after the release.
The more instructive moment came later. In fiscal 2017, AWS reported roughly $4.3 billion of operating income. Amazon's consolidated operating income for the same year was about $4.1 billion. The cloud segment earned more than the entire company because the International retail segment posted a loss large enough to absorb the gap.
Fiscal 2022 made the pattern starker. AWS generated about $22.8 billion of operating income on roughly $80 billion of revenue. Consolidated operating income was about $12.2 billion on roughly $514 billion of revenue. North America and International retail together lost more than $10 billion. The headline margin was about 2.4%. The cloud margin was closer to 28%.
Two different companies were sharing one ticker. The consolidated number described neither of them.
The practical point: when a company reports segments, the first thing to check is whether any single segment's operating income exceeds the consolidated total. If it does, you are looking at a subsidy, and the headline number tells you very little about either business.
Why segment disclosures exist in the first place
Segment reporting is the requirement, under US accounting rules (ASC 280), that a public company break out revenue, profit, and certain assets for each distinct business it manages separately. The rule uses what accountants call the management approach: segments must mirror how the chief operating decision maker, usually the CEO, actually reviews performance and allocates capital internally.
That design choice matters more than it looks. Regulators did not ask companies to carve themselves up by some external standard. They asked companies to show investors the same cut of the business that management already uses to make decisions. If the CEO receives a monthly report showing cloud profit separately from retail profit, the 10-K must show it too.
This makes the segment note one of the few places where outside investors see the internal scoreboard. The consolidated income statement aggregates under accounting conventions designed for comparability. The segment note discloses what management is actually watching.
There are limits. Companies get latitude in how they define segments, how they allocate shared costs, and how much detail they disclose. Two companies in the same industry can draw their segment lines very differently. Still, the disclosure is mandatory, audited, and tied to internal reporting, which makes it far harder to spin than an earnings call narrative or an investor-day slide.
For you, this means the segment note deserves more reading time than the management discussion that precedes it. The discussion is written to persuade. The note is written to comply.
The economic mechanism: why one segment subsidizes the rest
Why does this pattern appear at all? Because companies often own businesses at very different stages of their economic life, and management has strong incentives to fund the young ones with the cash from the mature ones.
The mechanism runs in a chain. A mature segment with pricing power and sunk infrastructure throws off high-margin cash. Management redeploys that cash into a growth segment that is still buying share, building capacity, or absorbing startup losses. The consolidated result shows modest profit and heavy reinvestment, which management describes as "investing for the long term." The blended margin compresses, and the market applies one multiple to the whole.
Several actors shape this outcome. Management prefers blending because it preserves capital allocation freedom. A cash cow reported alone invites demands to return its cash to shareholders. A loss-making segment reported alone invites demands to shut it down. Competitors are a second force: a highly profitable segment disclosed in detail tells rivals exactly where to attack, which is one reason companies resist granular breakouts. Analysts are the third: most sell-side models build from consolidated guidance, so the market's anchor is the blend.
Amazon's case fits the chain precisely. AWS had high incremental margins once the data centers were built. Retail, especially International, was spending on logistics, fulfillment networks, and new markets. Cloud cash funded retail expansion, and the consolidated statement presented a company barely clearing breakeven on a margin basis.
The mechanism is not unique to technology. Industrial conglomerates have historically leaned on a finance arm or a dominant product line to carry weaker divisions. Media companies have used a cable or licensing business to fund streaming losses. The pattern recurs often enough to check for it every time you open a multi-segment filing.
What this means for you: whenever a company describes heavy investment in a new area, find the segment that pays for it. The cash has to come from somewhere, and that somewhere is often the business the market is underpricing.
Pricing the pieces unblended: a worked example
The valuation question segments raise is called a sum-of-the-parts analysis: valuing each segment on its own economics, then adding the pieces. It frequently produces a different answer from applying one multiple to consolidated earnings.
Use the fiscal 2022 Amazon figures as the illustration, and treat the multiples below as assumptions for teaching the arithmetic, not as a recommendation.
Blended approach. Consolidated operating income was about $12.2 billion. Apply a single multiple of 30x operating income:
$12.2B × 30 = $366B
Unblended approach. Separate the pieces.
- AWS: about $22.8 billion of operating income. A profitable, high-growth infrastructure business might carry 25x operating income: $22.8B × 25 = $570B
- Retail (North America plus International): roughly $10.6 billion of combined operating loss on more than $430 billion of revenue. A loss-making business cannot be valued on earnings, so analysts switch to revenue. At 0.5x sales: $434B × 0.5 = $217B
Sum of the parts: $570B + $217B = $787B
The unblended figure is more than double the blended one. The gap does not come from optimism. It comes from the fact that a multiple applied to a blended earnings number penalizes the profitable segment for losses it did not generate, while simultaneously giving the loss-making segment credit for profit it did not earn.
Change the assumptions and the numbers move, but the structural point holds. When one segment's earnings exceed the consolidated total, a consolidated earnings multiple is the wrong tool. You need at least two valuation methods, one for the earner and one for the spender.
The practical step: rebuild the income statement by segment in a simple spreadsheet, assign each piece the valuation method that fits its economics, and compare the total with the current market capitalization. The difference is the size of the market's blind spot, or the size of your own error. Both are worth knowing.
How to read the segment note line by line
The segment note follows a recognizable structure, and a few lines carry most of the information.
Segment revenue and operating income. Compute the margin for each segment and its share of total operating income. A segment producing 15% of revenue and 70% of profit is the business you are actually buying.
Unallocated corporate costs. Most companies report a "corporate" or "eliminations" line that sits outside every segment. If it is large, segment margins are flattered, because real costs of running the business never reach any segment. Divide this line by total revenue and track it over time.
Intersegment revenue. When one segment sells to another, the transaction is eliminated on consolidation. The transfer price, the internal price charged between segments, is set by management. A generous transfer price can shift profit from one segment to another without any change in the underlying economics.
Segment assets and capital expenditure. Where disclosed, these let you compute return on assets by segment. A highly profitable segment that requires enormous ongoing capex may be less valuable than its margin suggests.
Changes in segment definitions. Read the comparison to prior years. When a company redraws its segment lines, ask what the old presentation would have shown.
Each of these lines answers a specific question: where the profit is, how clean it is, and how much capital it consumes.
Where the method breaks
Segment analysis has real failure modes, and a reader who ignores them will overstate the gap between the blend and the pieces.
The first is cost allocation. Shared expenses such as technology, real estate, and executive compensation are allocated by formulas management chooses. Amazon's retail and cloud segments share infrastructure and corporate overhead, and the split depends on internal methodology outside investors cannot audit. A segment margin is only as reliable as its allocation key.
The second is resegmentation. Companies periodically redefine segments, sometimes for legitimate organizational reasons and sometimes in ways that obscure a deteriorating unit. A new presentation can break the multi-year trend you need. When this happens, the restated prior periods in the filing are the only reliable comparison.
The third is the most important: the parts may not be separable. A sum-of-the-parts value assumes each segment could stand alone. Often it cannot. The retail business may depend on cloud-scale infrastructure, and the cloud business may have benefited from retail as its first and largest customer. Splitting them could destroy synergies that the blended entity enjoys. Conglomerate discounts persist for years precisely because the market doubts the breakup value will ever be realized, and management has little incentive to realize it.
The fourth is timing. A subsidized segment is not permanently a loser. Retail losses in 2022 reflected an overbuilt fulfillment network after the pandemic surge, and that segment's profitability improved as capacity was absorbed. Valuing a temporarily depressed segment at a trough multiple can be as wrong as ignoring it.
Your practical defense is to run the analysis with a range of allocations and multiples, and to treat the sum of the parts as a reference value, not a price target. If the unblended value only exceeds the market price under generous assumptions, the blind spot may not exist.
What the segment note changes about your process
The consolidated statement answers one question: what did the whole company earn? The segment note answers the questions that set value: which business earns it, which business spends it, and what each would be worth on its own terms.
Read the segment note before the earnings call transcript, not after. Compute each segment's share of operating income. Check whether any segment exceeds the total. Separate the earners from the spenders, value them with methods suited to their economics, and stress-test the allocations. The headline number is the average management chose to present. The segment note is where you find out what is being averaged.