Most weeks the Commitments of Traders report tells you nothing you can trade. In the few weeks it does, it is telling you that the trade everyone is in has run out of new participants. The report is a map of stored-up future orders, not a forecast. Reading it well means knowing when that store is full.
The yen short that ran out of sellers
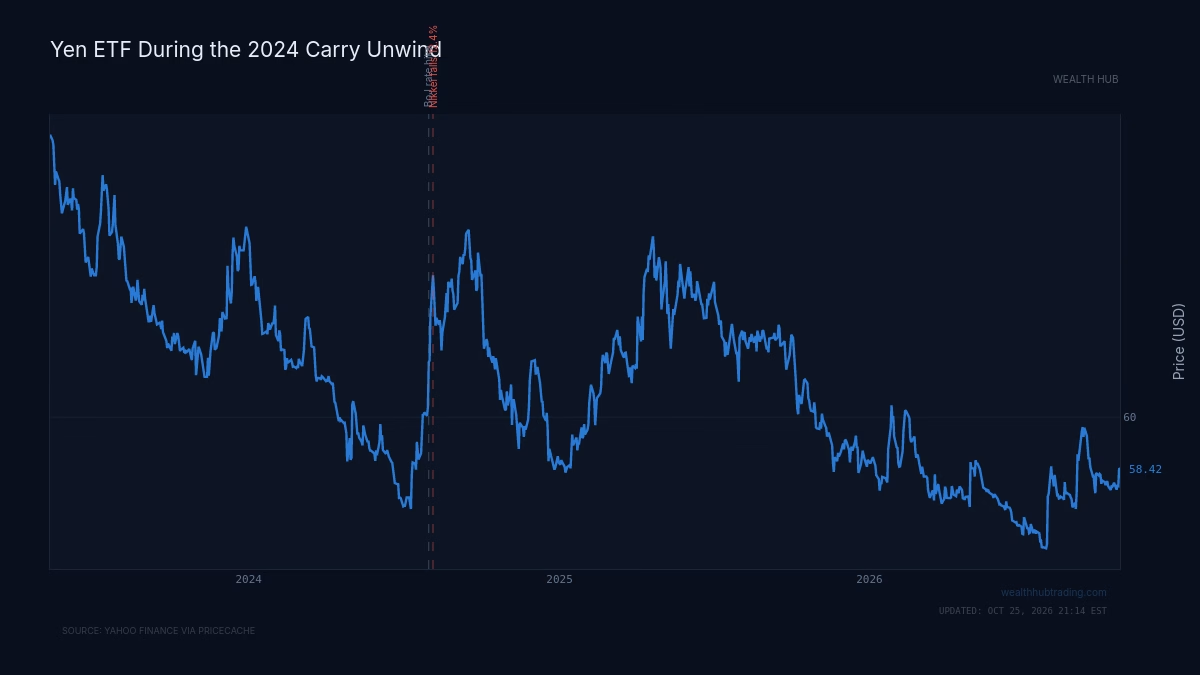
In the first week of July 2024, the dollar bought roughly 161 yen. That was the weakest the Japanese currency had been against the dollar in nearly four decades. The trade behind the move was easy to explain: borrow yen at close to zero, then hold dollar assets yielding above 5%. Hedge funds, commodity trading advisers and smaller speculators had piled in for months. By early July the weekly report showed non-commercial traders holding their largest net short in CME yen futures since 2007.
Nothing about that figure said "sell the dollar tomorrow." The position had been large for weeks, and the yen kept falling anyway. Then the Bank of Japan raised rates on July 31, and weak US payroll data followed on August 2. The carry math stopped working. By August 5 the dollar was trading near 142 yen, Japan's Nikkei had fallen 12.4% in a single session, and the VIX touched 65 intraday.
The report did not supply the date. It supplied the fuel. Every one of those short yen contracts was a future buy order, because a short futures position can only be closed by buying the contract back. When the reason for holding the position disappeared, those buy orders all arrived in the same few sessions. The price had been telling everyone the yen was a one-way bet. The positioning was telling anyone who looked that the bet had no one left to take the other side.
The rest of this explainer covers what the report actually measures, why the extremes carry information, and why the middle of the range carries almost none.
What the report actually records
The Commitments of Traders (COT) report is a weekly breakdown of open interest, meaning the total number of futures and options contracts outstanding in a market. The data comes from the Commodity Futures Trading Commission. Positions are measured as of Tuesday's close and published on Friday afternoon, so by the time you read the report it is already three days old.
The report only covers reportable positions. Those are accounts large enough to cross a size threshold the CFTC sets for each contract. The leftover open interest belongs to small traders and appears as nonreportable positions. Because open interest balances (every long has a short), the categories always sum to zero on a net basis. One group's extreme is always another group's extreme in the opposite direction.
The CFTC publishes the same underlying data in three formats, and the categories differ:
The Legacy report splits traders into commercials (entities hedging a business exposure), non-commercials (large speculators) and nonreportables. This is the oldest format and the one most historical studies rely on.
The Disaggregated report, introduced in 2009 for commodities, breaks commercials into producer/merchant/processor/user and swap dealers. It then splits speculators into managed money and other reportables. Managed money covers CTAs, commodity pools and hedge funds, the trend-sensitive capital that tends to crowd.
The Traders in Financial Futures report covers currencies, rates and equity index futures. Its groups are dealer/intermediary, asset manager/institutional, leveraged funds, and other reportables. Leveraged funds are the hedge-fund and CTA bucket, roughly equivalent to managed money.
The format matters because each one isolates a different behavior. If you want to know whether speculative capital is crowded, read managed money in commodities and leveraged funds in financials. Reading the Legacy non-commercial line instead blends those funds with other large traders who may be positioned for entirely different reasons.
Why the categories behave differently
Why does positioning carry any information at all? Different participants are forced to trade for different reasons, and those reasons predict how they respond to price.
Take a crude oil producer. When prices rise, the producer locks in the higher price by selling futures against future output. The higher the price, the more production becomes worth hedging, so the producer's net short grows into rallies. Consumers such as airlines and refiners do the reverse and buy more futures on dips. Commercial positioning therefore moves against the trend by construction. It is not a market call. It is a business doing risk management at prices it finds attractive.
Managed money and leveraged funds behave in the opposite way. Many of these funds run systematic trend-following models, and even discretionary funds size up when a trade is working. Their positions grow with the trend. That is profitable while it lasts, but it runs into three hard limits.
The first limit is capital. A fund cannot keep adding to a position forever, and neither can the whole category. When speculative net length sits at the top of its multi-year range, the pool of capital still willing to buy has mostly been used up. The second limit is risk control. Value-at-risk budgets and margin requirements tighten as volatility rises, so a crowded position that starts moving the wrong way gets cut mechanically, not by choice. The third limit is the one the yen episode made vivid: every open position is a future order in the opposite direction. A record speculative long amounts to a record backlog of future selling.
The extreme carries information because it marks the point where the marginal buyer is exhausted and latent supply is at its peak. The middle of the range carries none because neither condition holds. Positions are not stretched, capital is not used up, and no forced unwind is waiting.
In practice, treat speculative extremes as a measure of how far price can move against the crowd once a catalyst arrives. Do not treat them as a signal that the catalyst is coming.
Turning raw positions into a reading
Raw contract counts are hard to compare. A net long of 300,000 contracts means one thing in crude oil and something else in a thinly traded contract, and open interest itself grows and shrinks over the years. The standard fix is to rank the current position against its own history. The best-known version is the Williams COT Index, associated with trader Larry Williams:
COT Index = (Current Net − Lowest Net over lookback) / (Highest Net − Lowest Net over lookback) × 100
A reading of 100 means the group is as net long as it has been at any point in the lookback window. A reading of 0 means it is as net short as it has ever been in that window. Three years of weekly data, or 156 reports, is a common lookback.
Here is a worked example with illustrative numbers. Suppose managed money's net position in a commodity ranged from a low of −20,000 contracts to a high of 380,000 over the past 156 weeks, and this week it stands at 362,000.
COT Index = (362,000 − (−20,000)) / (380,000 − (−20,000)) × 100 = 382,000 / 400,000 × 100 = 95.5
That reading puts the funds in the top 5% of their own three-year range, which is crowded territory. Now suppose the current position were 180,000 instead.
COT Index = (180,000 + 20,000) / 400,000 × 100 = 50
A reading of 50 is the middle of the range, and it is exactly where the report stops being useful. Funds are long, but they are neither stretched nor out of capacity. A crowd at 50 can push price higher or lower depending on what the trend does next, and the report says nothing about which way that will go.
A second normalization is worth running alongside the index: net position as a percentage of total open interest. If open interest has doubled over the lookback, a record contract count may simply reflect a bigger market, not a more crowded one. A position that is extreme on both measures deserves more weight than one that is extreme on only one.
When you build this screen, set your thresholds before you look at price. Readings above roughly 90 or below roughly 10 qualify as edges. Everything between them gets ignored, however tempting the story.
Where the edge disappears
The contrarian reading fails in predictable ways. Knowing those ways is what separates using the report from being misled by it.
Extremes can get more extreme. A three-year lookback defines "record" relative to a limited history. A strong trend can push positioning through the top of the range and keep it there for months. The yen short sat near multi-year extremes for a long stretch before it broke, and anyone who faded it early lost money on carry and on price. An extreme tells you the trade is fragile. It does not tell you the trade is finished.
The lag can swallow the signal. Tuesday data published on Friday means a fast unwind can be half complete before the report confirms it began. In August 2024 the most violent move happened between two reports.
Category labels hide motives. A swap dealer's futures position often offsets an over-the-counter swap sold to a client. That makes it a pass-through hedge, not a view. Asset managers in equity index futures are frequently hedging or equitizing cash, not betting. Reading every large position as conviction misreads the report.
Structural change resets the baseline. When new kinds of participants enter a market, such as commodity index funds in the mid-2000s, "normal" positioning shifts and the historical range no longer describes the present.
Treat a COT extreme as a conditional statement: if the catalyst arrives, the move will be larger than the fundamentals alone would suggest. Then look for the catalyst in price, policy or data, not in the report.
Reading the report today
This explainer does not cover current positioning figures for specific markets, and the framework does not depend on them. The routine is the same in any contract. Pick the category that isolates trend-following capital: managed money for commodities, leveraged funds for financials. Compute its COT Index over a fixed lookback and cross-check it against net position as a share of open interest. Act only on readings at the edges.
When you do find an edge, the useful question is not whether the crowd is wrong. Crowds at extremes are often right about direction for a while. The useful question is how much forced buying or selling is stored in that position, and what event would release it. In July 2024 the answer was the Bank of Japan. In other markets it might be an inventory report, a central bank meeting, or simply a trend model flipping its signal. Positioning sizes the move. The catalyst times it.
The COT report measures how much of a market's future order flow is already committed in one direction. That is why it speaks loudly at the extremes and stays silent in the middle.