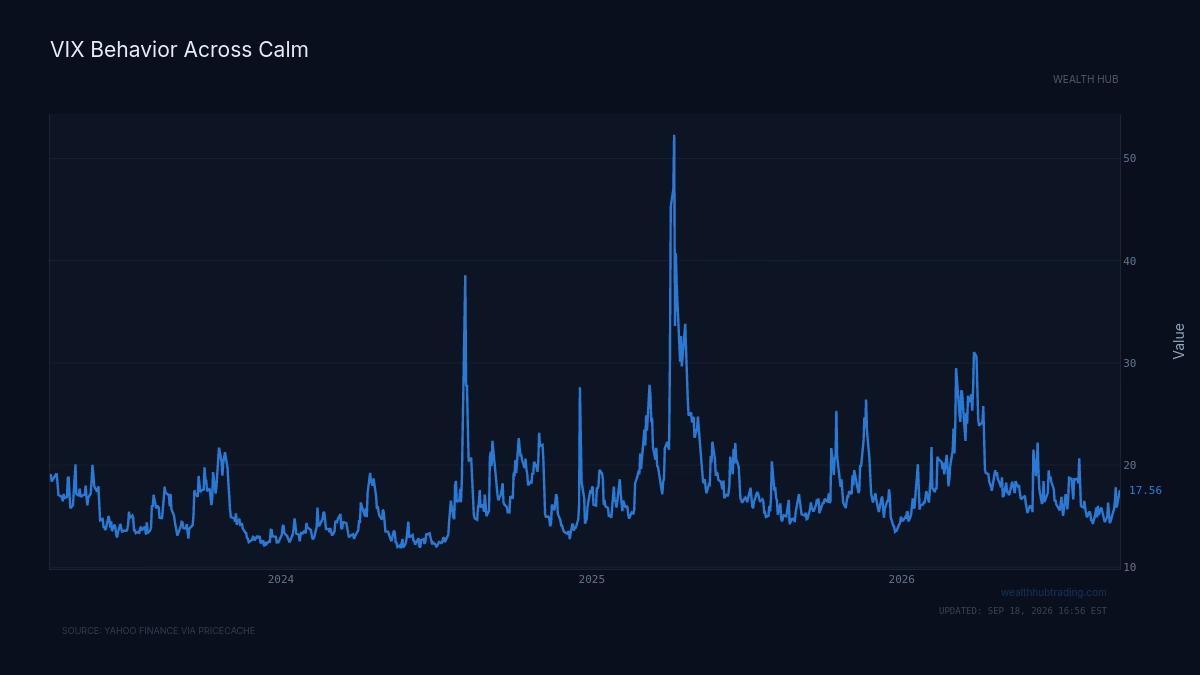
On February 5, 2018, a product called XIV lost roughly 96% of its value in a single afternoon. The fund existed to harvest one thing: the profit from se...
For years that trade paid quietly and steadily. Then the curve inverted in minutes, the fund's exposure exploded, and the mechanism that had printed money for its holders liquidated them.
That episode is the cleanest lesson available on what the term structure of volatility actually is and why its shape matters more than its level.
What the term structure of volatility measures
The term structure of volatility is the set of prices the market assigns to volatility across different expiry dates. In practice you read it through VIX futures: the front-month contract prices expected S&P 500 volatility over the next month, the second month prices it further out, and so on down the curve.
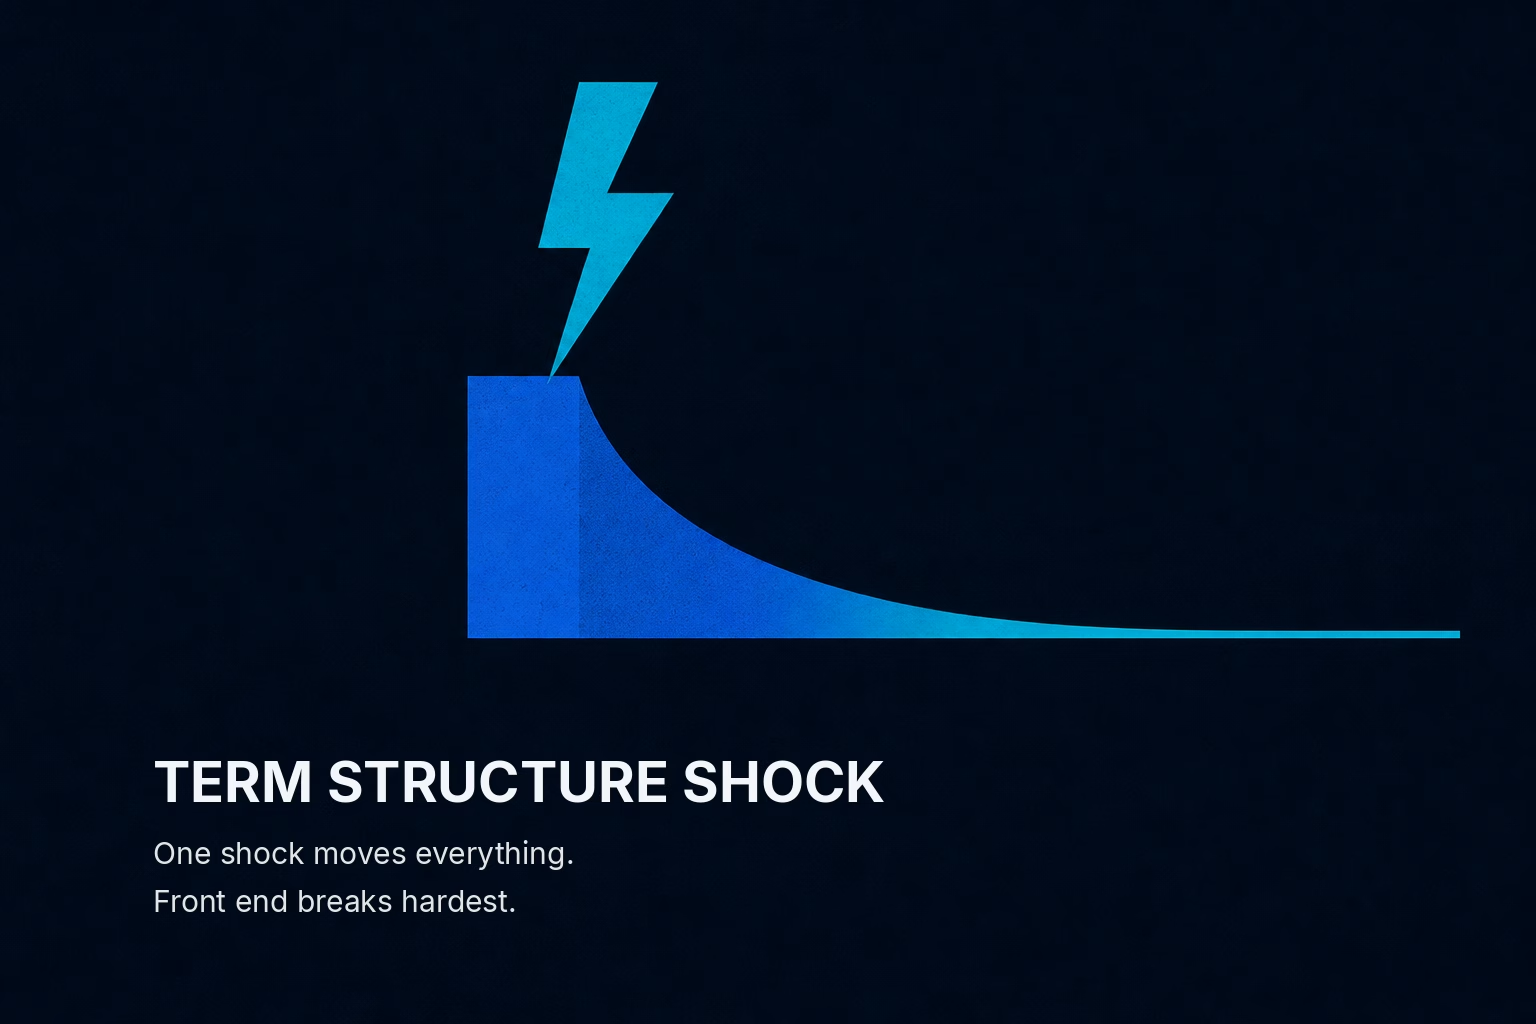
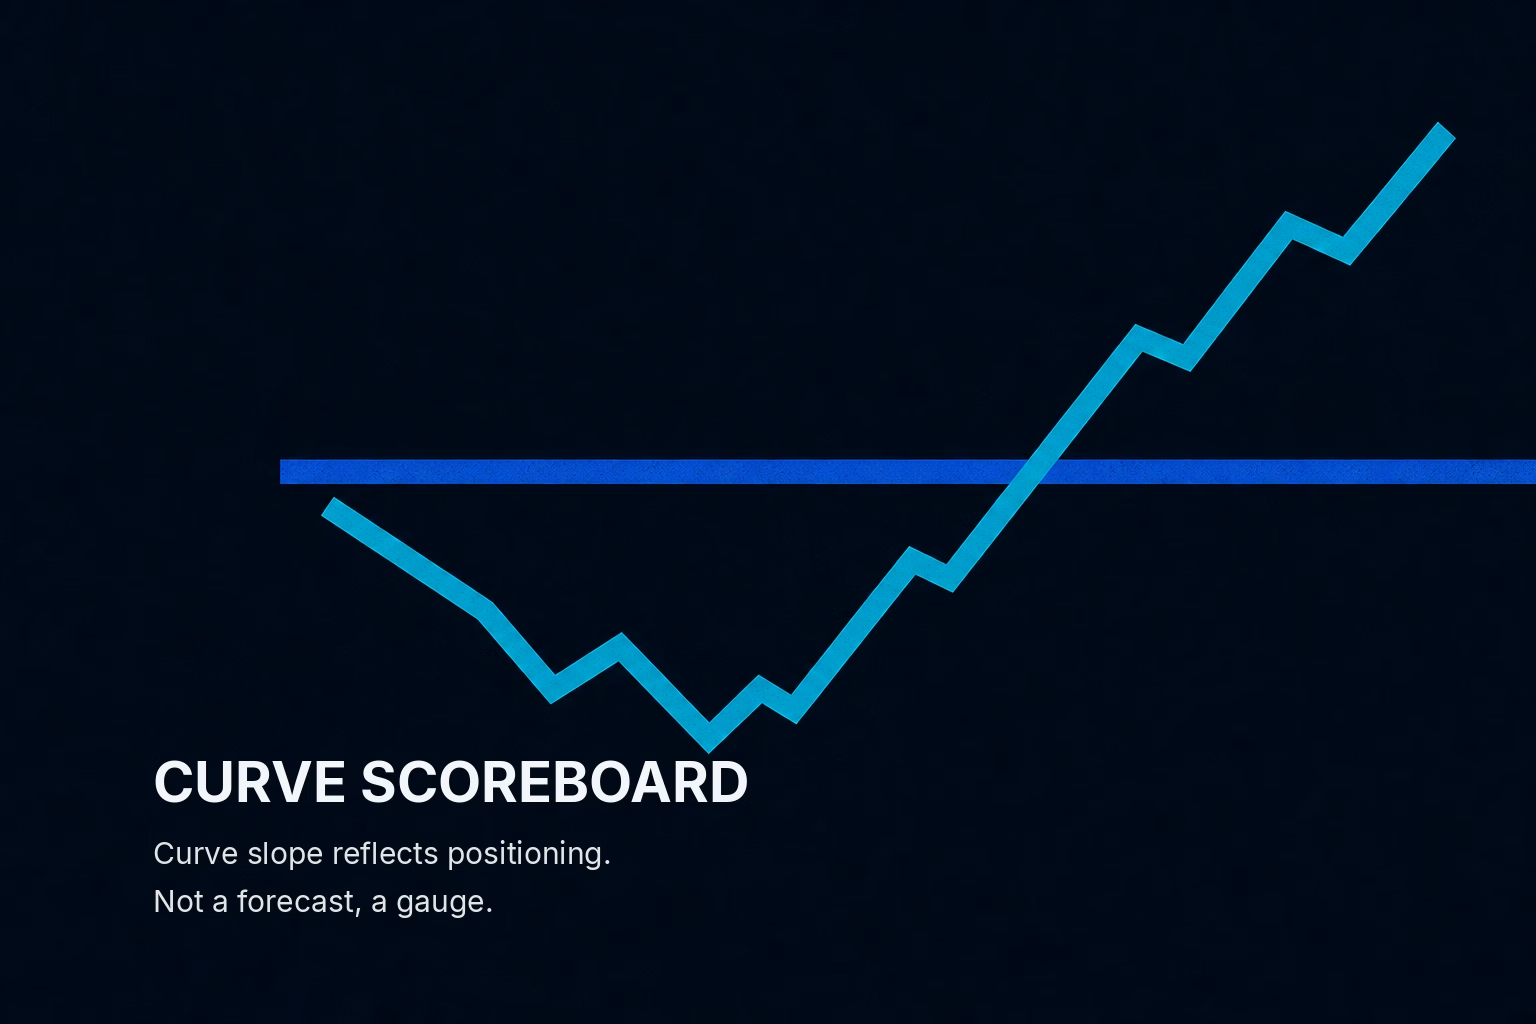
Contango is the normal state: further-dated volatility futures trade above nearer-dated ones. The curve slopes up. Backwardation is the stressed state: the front month trades above the back months. The curve slopes down.
Most explanations stop there and treat the slope as a forecast, as if an upward curve means "the market expects more volatility later." That reading misses the mechanism. The slope is less a prediction than a record of what participants are being paid, or forced, to do right now.
Why contango exists and who it pays
Contango is the default because volatility is something most large holders want to buy as insurance. Pension funds, insurers, and asset managers pay a premium to hold protection against a market drop. That persistent demand for downside insurance keeps longer-dated volatility priced above the calm spot reality.
That gap creates a specific payment. When the curve is in contango, whoever sells the front-month contract and rolls into the next one earns the difference as the near contract "rolls down" toward the lower spot level over time. This is the roll yield: the return earned purely from a contract's price converging toward spot as it approaches expiry.
Consider a simplified version. Suppose the front-month VIX future trades at 16 and the second month at 18, while spot VIX sits at 14. A seller of the front contract collects, over the month, the drift of that 16 back toward 14 as expiry nears, a two-point gain on a position that required no directional bet on stocks. Repeat that every month while the curve stays upward-sloping and you have the strategy XIV was built to automate.
Why does this matter? Because the seller is not a passive observer. The party short volatility must hedge, and hedging in a rising market means buying the dip, which dampens realized volatility, which flattens the curve further, which reinforces the trade. The calm feeds on itself. For a reader, the takeaway is direct: a persistently steep contango is not evidence of safety, it is evidence that a large, self-reinforcing short-volatility position has built up beneath the surface.
What backwardation is really telling you
Backwardation flips the entire structure. When the front month trades above the back months, the market is not saying "we expect trouble ahead." It is saying trouble is here. Near-term volatility is priced highest because demand for immediate protection is overwhelming demand for distant protection.
The distinction is between an event and a regime. An upward curve prices risk as an event: something might happen out there, so distant insurance costs more. A downward curve prices risk as a regime: the stress is present, and the market wants coverage now, at any price, before it worsens.
This is where the flow reading becomes essential. Backwardation rarely arrives gently, because the short-volatility crowd that thrived in contango cannot survive the inversion. As the front month spikes, their positions lose money faster than the back months, and their hedging flips from stabilizing to destabilizing. A seller who was buying dips to stay neutral must now sell into weakness to cut exposure. That forced selling is not a reaction to the news, it is a reaction to the position.
The practical point: when you see the VIX curve invert, the most important thing happening is often not the headline that triggered it. It is the unwind of the crowd that was paid to keep the curve upward-sloping in the first place.
The February 2018 unwind, mechanism by mechanism
Return to XIV. In early 2018 volatility had been suppressed for months, contango was steep, and short-volatility products had swollen with capital. The design of these products required them to rebalance daily to maintain constant exposure. When volatility rose, they had to buy VIX futures to reduce their short. That rebalancing was small when moves were small.
On February 5, the S&P fell sharply into the close and the front-month VIX future roughly doubled. The daily rebalancing rule now demanded that these products buy an enormous quantity of VIX futures near the settlement window, precisely when liquidity was thinnest. Their own required buying pushed the front month higher, which increased the buying they were required to do. The curve slammed into backwardation. XIV's value collapsed and it was terminated within days.
No new economic information caused a 96% loss in an afternoon. The mechanism was positioning: a crowded short-volatility trade whose hedging rule became a forced buyer of the very thing destroying it. The curve's shape did not forecast the blowup; the curve's shape was the blowup.
When the shape lies
The term structure is a powerful read, but it is not infallible, and understanding its failure modes matters as much as understanding its logic.
The first failure is treating the slope as a directional signal for stocks. Contango can persist through slow market declines, and backwardation can appear during sharp rebounds when hedges are being repriced rather than markets falling. The curve reads volatility demand, not price direction.
The second failure is assuming the roll yield is free. The short-volatility trade pays consistently right up until the moment it doesn't, and its losses are not proportional to its gains. Years of two-point monthly gains were erased in a single session in 2018. Any strategy that earns a small premium by absorbing tail risk carries this asymmetry, and the curve's calm is exactly when that risk is largest and least visible.
The third failure is over-reading brief inversions. A one-day dip into backwardation around a scheduled event, an FOMC meeting or a major data release, often reflects tactical hedging that reverses immediately. Sustained backwardation, held over multiple sessions, is the meaningful signal because it indicates the short-volatility complex is genuinely unwinding rather than briefly flinching.
What to do with the curve
The term structure of volatility is a real-time scoreboard of positioning, not a crystal ball for prices. Its slope tells you whether the market is being paid to sell insurance in calm, or forced to buy it in stress.
Read contango as a measure of how much short-volatility risk has accumulated, not as a promise of continued calm; the steeper and longer it persists, the larger the eventual unwind can be. Read sustained backwardation as confirmation that the unwind is underway, and understand that the forced hedging of the losing crowd, not the triggering headline, is often what moves the tape. Watch the curve to see what dealers and systematic funds are being compelled to do next, because in volatility the flow tends to arrive before the fundamentals.