On October 19, 1987, the S&P 500 fell 20.5% in a single session. Before that Monday, options traders priced puts and calls off Black-Scholes as if every...
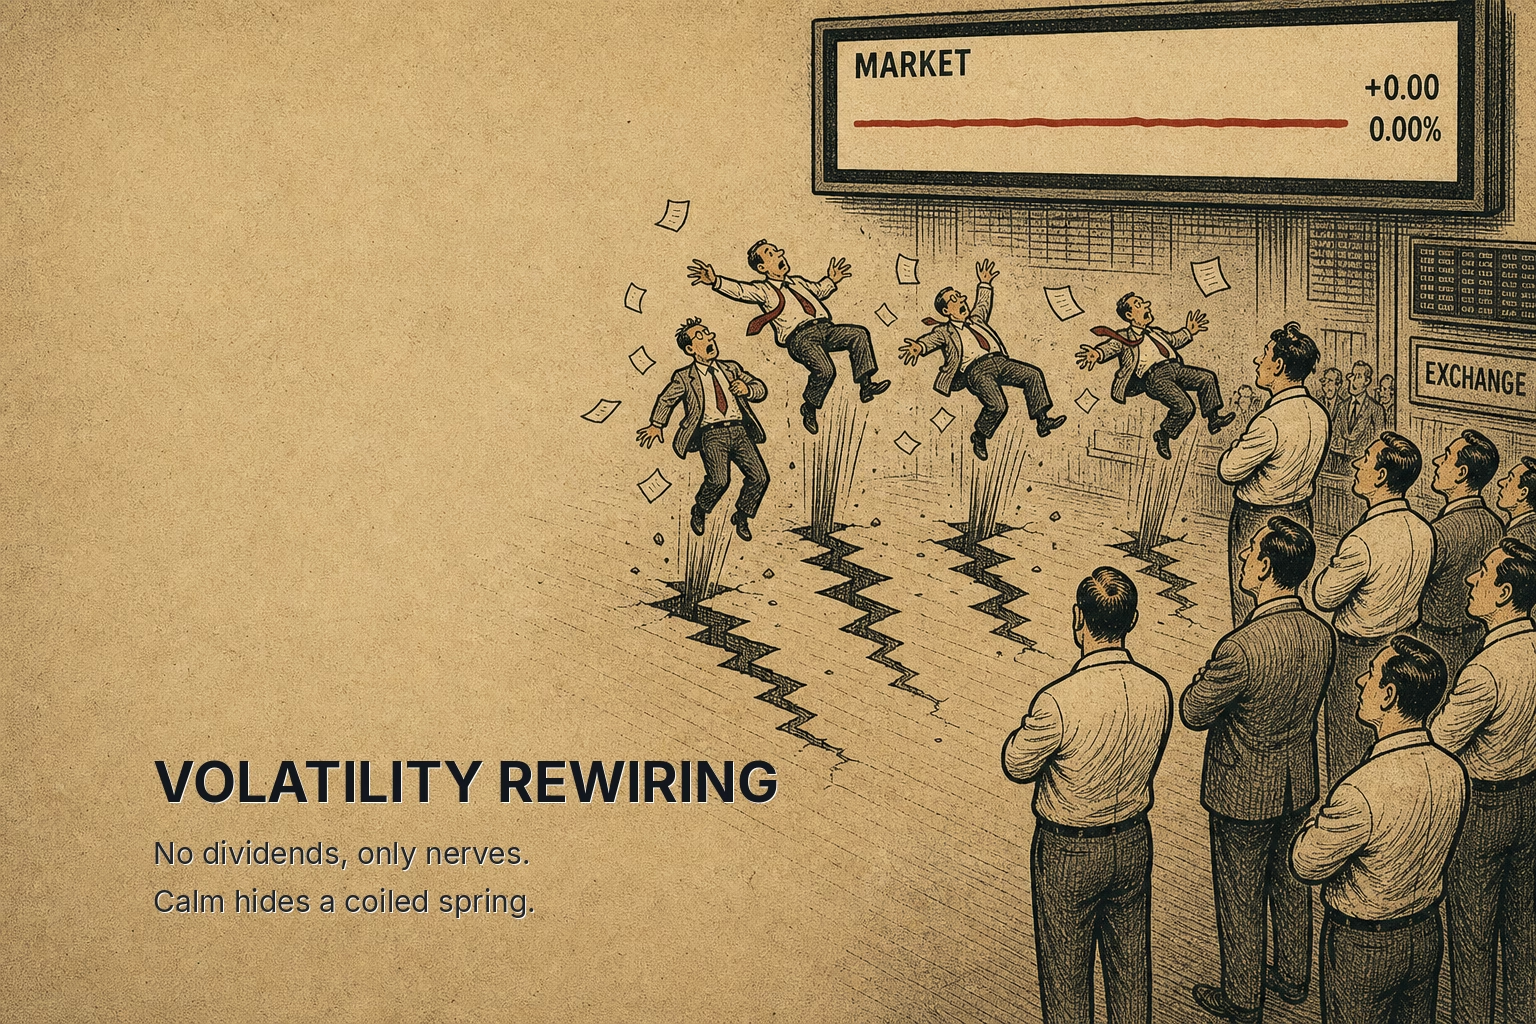
On October 19, 1987, the S&P 500 fell 20.5% in a single session. Before that Monday, options traders priced puts and calls off Black-Scholes as if every strike carried the same implied volatility. After it, they stopped. A market that had just watched prices gap through every downside strike at once could no longer pretend that a 20% drop and a 20% rise were equally likely. Out-of-the-money puts began trading at higher implied volatilities than at-the-money options, and that gap never fully closed. What traders now call the volatility skew was born in the wreckage of a single crash.
That episode is the cleanest way to understand what the volatility surface encodes. It is not a forecast of where the index will go. It is a ledger of what the market is afraid of being wrong about, and which insurance policies are already crowded.
Why the surface is not flat
Start with the object itself. The volatility surface is the full grid of implied volatilities across every strike and every expiration for a given underlying. Implied volatility is the volatility number you must plug into an options pricing model to make the model's price match the market's price. If Black-Scholes were literally true, that number would be identical for every strike on a given expiry. The surface would be flat.
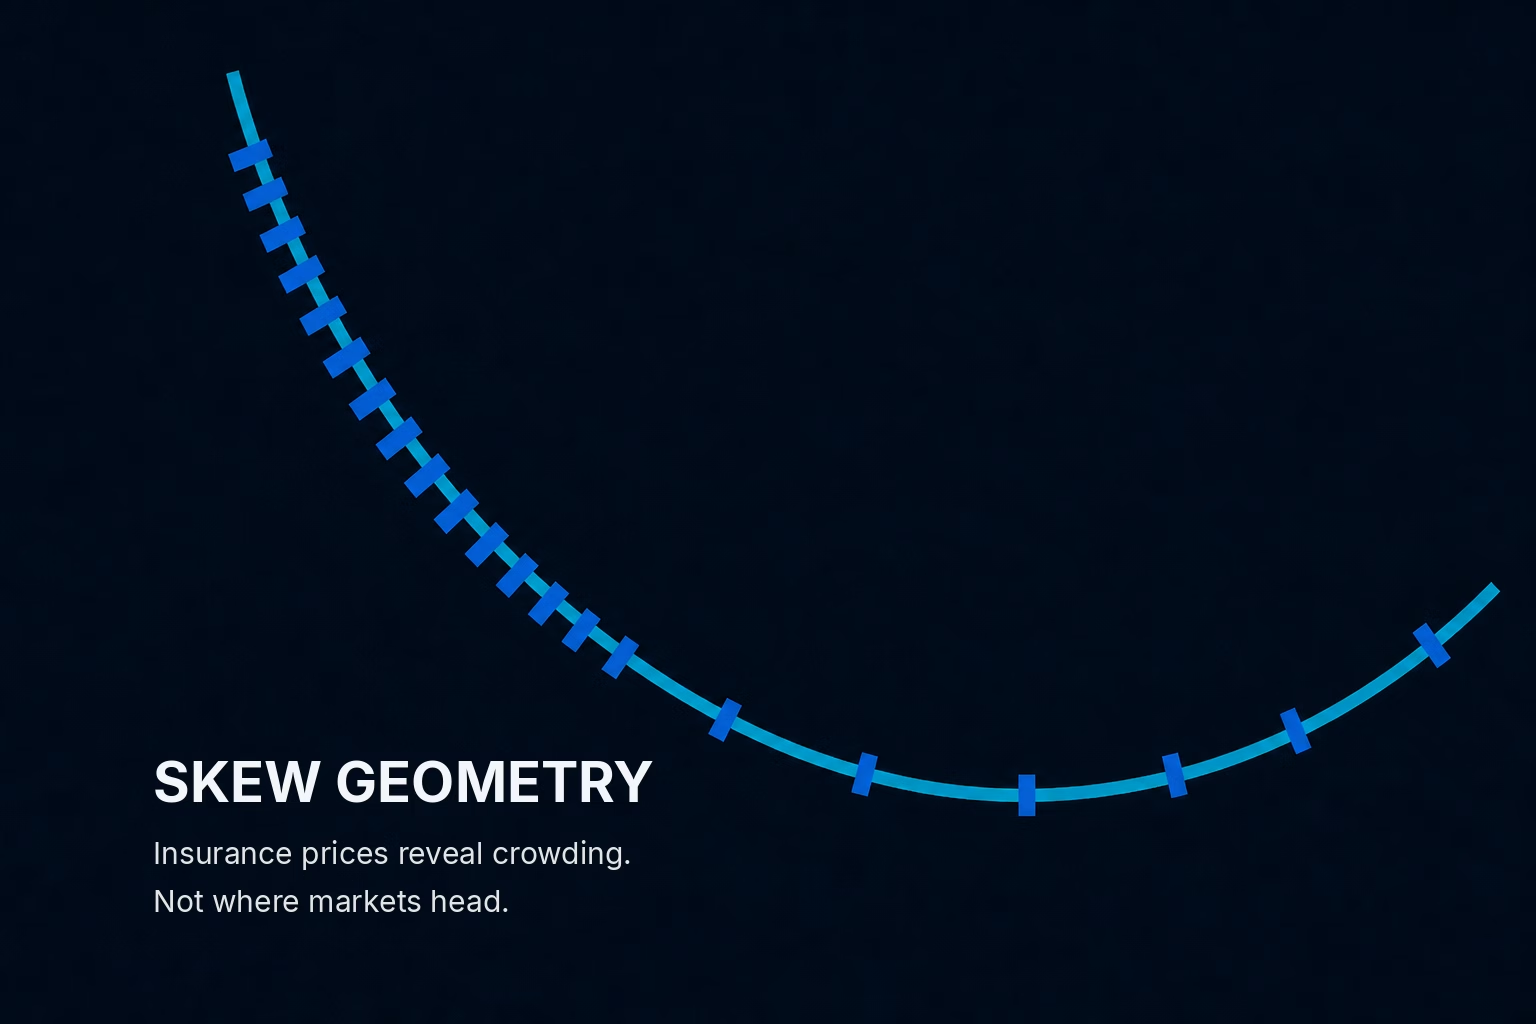
It is not flat. Slice the surface at a single expiration and you get the volatility smile or, in equity indices, the volatility skew: implied volatility rises as strikes move down toward crash territory and falls as strikes move up. A put struck 20% below spot routinely carries a higher implied volatility than a call struck 20% above it.
The reason is demand, not statistics. Someone has to sell the crash puts, and the people who buy them, pension funds hedging equity books, insurers with guaranteed products, portfolio managers who cannot afford a 1987, are structurally long protection. That persistent one-sided demand bids up the price of downside strikes. Higher price means higher implied volatility. The skew is the price of crash insurance, quoted in volatility units, written into every strike.
The practical takeaway is simple: when you read a steep skew, you are reading how expensive protection has become, not how likely a crash is. Those are different things, and confusing them is the first mistake.
What the shape actually tells you
Here is the mechanism that most readers of the surface skip past. The level of implied volatility tells you how much the market will pay for optionality in general. The shape of the surface, how much steeper puts are than calls, how fast volatility rises as you go further out of the money, tells you about the composition of demand.
Think about who trades each part of the curve. At-the-money options are traded by everyone, so their implied volatility reflects broad consensus about near-term movement. Deep out-of-the-money puts are traded almost exclusively by hedgers buying and dealers selling. When those far-downside strikes get expensive relative to the at-the-money level, it means hedging demand has intensified faster than general demand for optionality.
A steepening skew, then, is a positioning signal. It says protection is being bought, that the marginal buyer is a hedger rather than a speculator, and that dealers are accumulating short-put inventory they will have to manage. None of that tells you the index is about to fall. It tells you the market has already decided a fall is the thing worth insuring against.
Compare two regimes. Before the 2018 volatility spike, short-volatility strategies had grown enormous, and the skew was relatively flat because so many participants were selling downside protection to harvest premium. The demand that normally steepens the skew had been overwhelmed by supply. When the move came in February 2018, those sellers were forced to cover into a market with no protection cushion, and the reflexive scramble to buy back volatility was violent precisely because the surface had told you, in advance, that nobody was hedged.
What this means for you: read the skew's steepness as a crowding gauge. A flat skew in a complacent market is not reassuring. It often means the hedgers have left and the sellers have taken over.
The dealer hedging mechanism that moves the tape
The surface is not just a mood ring. It creates real flows, and those flows move prices. This is the part consensus ignores because consensus reads the tape, not the plumbing underneath it.
When a dealer sells a put to a hedger, the dealer is short that put and must neutralize the directional risk by shorting the underlying. That is delta hedging: adjusting a position in the underlying to offset the directional exposure of an option. But the amount the dealer must hedge changes as the underlying moves, and the rate of that change is governed by the option's curvature.
Consider the causal chain. Dealers sell downside puts to hedgers. To stay directionally neutral, dealers short futures against those puts. As the index falls, each put's sensitivity to price grows, so the dealer must short more futures into a falling market. That mechanical selling accelerates the decline. The move feeds itself, not because anyone forecast it, but because the hedging math forces sellers to sell more as prices drop.
This is why crashes gap. In 1987, portfolio insurance, a strategy that required selling futures as the market fell, produced exactly this feedback. The strategy was marketed as protection, but in aggregate it was an engine that converted a decline into a collapse. The volatility surface after 1987 permanently repriced that risk because the market learned that downside moves are not symmetric with upside moves; the hedging flows underneath them are one-directional and self-reinforcing.
The practical implication is that when you see a steep skew and heavy dealer short-put inventory, you are looking at a market where a downside move would meet mechanical selling rather than absorption. The surface is telling you the path would be jagged, not that the path is coming.
Reading the term structure
Slice the surface the other way, across expirations at a fixed moneyness, and you get the term structure of volatility. Normally near-dated implied volatility sits below longer-dated, an upward slope, because uncertainty compounds over time and short horizons are calmer. That is contango.
When the term structure inverts, near-dated volatility above longer-dated, it is called backwardation, and it is one of the more honest fear signals the surface produces. Inversion means the market is paying up for immediate protection relative to protection three months out. It reflects an acute, dated worry: an earnings print, an election, a central bank meeting, a war headline.
The reason backwardation matters as a positioning read is that it is expensive to hold. Near-dated options decay fast. A market willing to pay that decay premium is a market whose hedging demand has a specific near-term catalyst in view. When the catalyst passes without incident, the front of the curve collapses, and the volatility sellers who waited get paid. When it does not pass cleanly, the whole surface can shift up at once.
What this means for you: an inverted term structure is a clock, not a compass. It tells you the market has priced a near-term event as the thing to fear, and it tells you roughly when the fear resolves. It does not tell you which way the resolution breaks.
Where the surface misleads
The surface is a positioning document, and positioning documents lie in a specific way: they tell you what is crowded, and crowded things unwind in the direction nobody is hedged for.
The most common misapplication is treating a steep skew as a bearish forecast. A steep skew is the opposite of an un-hedged market. If everyone has already bought puts, the downside is insured, and the pain trade is a grind higher that bleeds the hedgers' premium. The 2008 crash was preceded by a skew that had grown expensive for years without preventing the eventual collapse, because the timing of a positioning signal is never encoded in the level. The surface told you protection was crowded; it never told you when.
The second failure mode is assuming the mechanism is permanent. Dealer positioning flips. When dealers are net long options rather than short, their hedging flows dampen moves instead of amplifying them, because they buy dips and sell rips to stay neutral. The same surface geometry can produce stabilizing or destabilizing flows depending on which side of the inventory the dealers sit. You cannot read the direction of the feedback from the skew alone; you need to know who owns the gamma, and that is not something the price of the options tells you directly.
The third trap is reading a single underlying's surface in isolation. Skew crowding in one index can be a hedge for exposure somewhere else entirely, an equity put bought against a credit position, a currency option bought against an emerging-market book. The surface encodes demand, but demand has motives the surface does not label.
So use the surface for what it is good at. It is a real-time census of where fear is concentrated and where hedges are stacked. It is excellent at telling you what the market is insured against and therefore where the market is quietly exposed. It is worthless as a directional forecast, and anyone selling it as one has mistaken a map of positioning for a map of the future.
The volatility surface is a ledger of crowded hedges priced strike by strike, and its value is that it shows you where the market is protected, which is exactly where the next surprise is most likely to hurt.