On February 5, 2018, the S&P 500 fell more than 4% and the VIX, the index that measures expected volatility, more than doubled in a single session. The ...
On February 5, 2018, the S&P 500 fell more than 4% and the VIX, the index that measures expected volatility, more than doubled in a single session. The move that later carried the name "Volmageddon" wiped out a cluster of products that had bet on volatility staying low. Most of the coverage focused on those products. The more useful story was happening one layer down, at the trading desks that had sold the options everyone else was holding.
Those desks were short gamma. As the market fell, their own risk models forced them to sell more, into a market that was already falling. The selling was not a view. It was a hedge, executed mechanically, and it turned an ordinary decline into a cascade. Understanding why requires understanding what dealers are actually doing when they take the other side of an options trade.
What a dealer is hedging, and why it is not optional
When you buy an option, someone sells it to you. That seller is usually a dealer, a market-making desk whose business is providing liquidity, not betting on direction. Having sold you the option, the dealer now carries a directional risk it does not want. To neutralize it, the dealer buys or sells the underlying instrument so that small moves in price no longer change the value of its total position. This is called delta hedging, where delta is the rate at which an option's value changes as the underlying moves.
The problem is that delta itself changes as the price moves. Gamma measures that second effect: it is the rate at which delta changes. Because gamma keeps shifting the hedge target, the dealer must keep adjusting. It cannot hedge once and walk away. It hedges continuously, and the direction of that continuous adjustment depends entirely on whether the dealer is long or short gamma.
For you, the practical point is this: dealer hedging is not a market opinion. It is a legal and risk-management obligation to stay neutral. That is precisely what makes it predictable enough to matter.
Long gamma dampens; short gamma amplifies
A dealer is long gamma when the net effect of its book is to have bought the options the market wanted to sell. In that state, its hedge leans against price. When the market rises, the dealer sells the underlying to stay neutral; when the market falls, it buys. Selling into strength and buying into weakness is stabilizing behavior. It pins price into a range and suppresses volatility, not because the dealer wants calm, but because the arithmetic of staying neutral demands it.
A dealer is short gamma when it has net sold the options the crowd wanted to buy, typically puts bought as portfolio insurance. Now the hedge runs the other way. When the market falls, the dealer must sell the underlying to stay neutral; when it rises, it must buy. This is buying into strength and selling into weakness, the opposite behavior, and it accelerates whatever move is already underway.
The same desk, the same arithmetic, produces opposite market effects. The sign is set by what the crowd bought. When the crowd is long insurance, the dealers who sold it are short gamma, and the market's stabilizer becomes its accelerant.
That is the mechanism that turned February 2018 from a bad day into a rout. The products that blew up had, in effect, left dealers structurally short volatility. As the decline began, the required hedge was to sell more, and the selling fed the decline it was meant to offset.
Why the same setup pins price on calm days
Most of the time, markets are quiet, and the reason is partly this same mechanism running in reverse. In a calm regime, dealers are often net long gamma, especially near large option strikes where a lot of open interest clusters. Their stabilizing hedge acts like a magnet. As price drifts toward a heavily traded strike, dealer flows lean against the drift, and price tends to settle near that level into expiration.
This is why an index can spend a week trading in a narrow band that seems to defy the news flow. The band is not the market's considered judgment about fair value. It is the residue of thousands of small hedging trades, each one leaning against the last move, holding price in place.
Here is a simplified version of the arithmetic to make the leaning concrete. Suppose a dealer's book has gamma of 5,000 shares per one-point move in the index. If the index rises one point, the dealer's delta increases by 5,000 shares, and to stay neutral it must sell 5,000 shares. If the index rises another point, it sells another 5,000. Every upward point triggers selling; every downward point triggers buying. Long gamma is a self-correcting loop.
Flip the sign. If the dealer is short gamma by the same 5,000 shares per point, a one-point rise forces it to buy 5,000 shares, pushing price further up, which forces more buying. The loop now reinforces the move instead of correcting it. The magnitude is the same. Only the direction of the required trade has reversed.
For you, the takeaway is that a quiet, range-bound tape and a violent, trending tape can be produced by the identical desk running the identical process. The regime you are in depends on the sign of dealer gamma, and the sign depends on positioning you cannot read off the price chart alone.
When the mechanism breaks down
This is not a law of markets, and treating it as one is how traders get hurt. Several things can sever the link between dealer gamma and price behavior.
The first is expiration. Options positioning resets on expiration dates, and a large block of gamma that pinned price all week can simply vanish. A market that felt glued to a level can move freely once the position that held it expires.
The second is speed. Dealers hedge continuously in theory, but in practice they hedge as fast as liquidity allows. When a move is faster than the desk can trade, or when liquidity thins out, the hedge lags the price. A short-gamma desk that cannot sell fast enough does not stabilize anything; it amplifies through absence as much as through action. Fast gap moves are exactly where the neat arithmetic fails.
The third is that dealer gamma is an estimate, not a published figure. Analysts infer it from open interest and modeled dealer positioning, and the inference can be wrong about which strikes matter or which side the dealers are actually on. A confident story about the "gamma flip level" is only as good as the assumptions behind the estimate, and those assumptions are not observable in real time with certainty.
The practical discipline is to treat gamma positioning as a description of the current regime's fragility, not a prediction of the next move. It tells you whether a shock is likely to be absorbed or amplified. It does not tell you when the shock arrives.
What this means for how you read the tape
The visible thing is price. The mechanism underneath is a hedge desk with no choice about the direction of its next trade. When dealers are long gamma, the market has a built-in shock absorber, and calm tends to persist longer than the news would justify. When dealers are short gamma, the market has a built-in accelerant, and a small catalyst can produce a move far larger than the catalyst warrants.
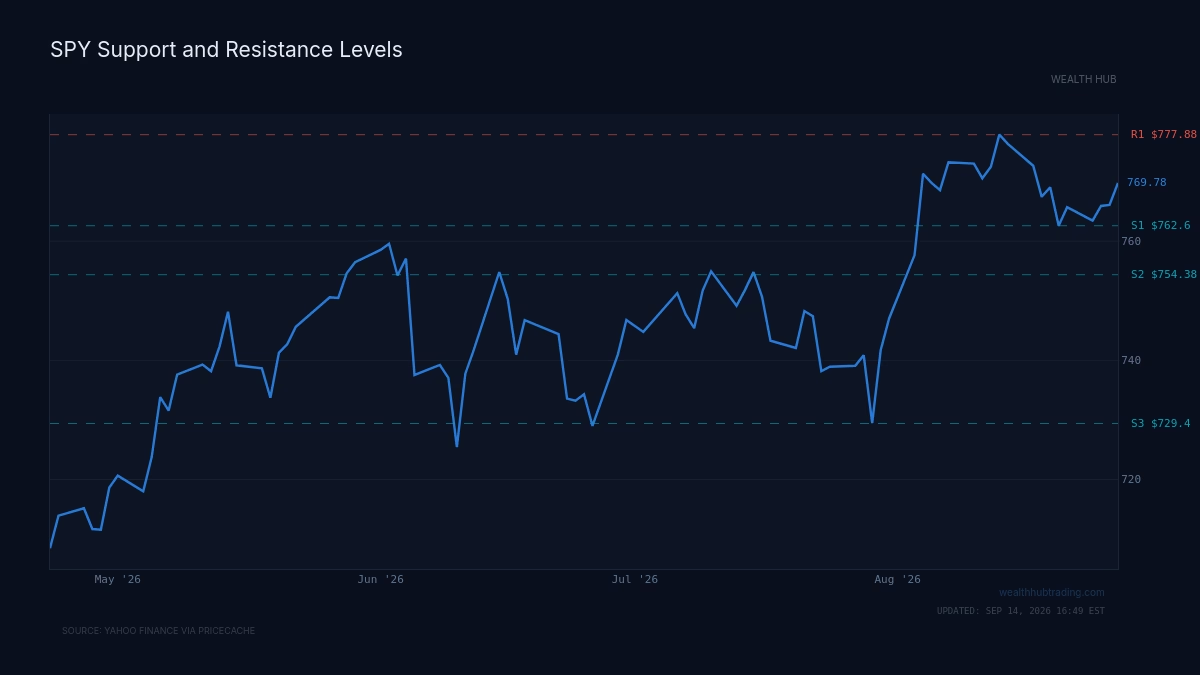
You cannot see the sign of dealer gamma on a price chart. What you can do is stop treating suspiciously calm ranges and suspiciously violent breaks as separate phenomena. They are frequently the same arithmetic with the sign reversed. The chart below marks where price has repeatedly stalled and turned, the levels near which heavy option interest tends to cluster and where dealer hedging pressure most often concentrates.
The single sentence to keep: dealer hedging pins price when dealers are long gamma and accelerates it when they are short, and the sign is set not by the dealers but by what the rest of the market chose to buy.