In the summer of 2013, the 10-year Treasury yield rose by well over a full percentage point while the market's inflation expectations fell. That combination explains why gold, emerging-market currencies, and long-duration equities took heavy damage that summer while the inflation story stayed quiet. The headline was "yields up." The real event was a sharp rise in real yields, and it was the real-yield leg that spread into other markets.
The lesson from that episode applies today. A nominal yield bundles two different prices. Which of the two is moving tells you more about what breaks next than the yield level does.
The summer of the taper tantrum
On May 22, 2013, Ben Bernanke told Congress the Federal Reserve could slow its bond purchases "in the next few meetings." The 10-year nominal yield had started May near 1.6%. By early September it was close to 3%.
The 10-year TIPS yield did most of the work. It climbed from roughly minus 0.7% to nearly plus 0.9%. TIPS (Treasury Inflation-Protected Securities) are government bonds whose principal adjusts with the consumer price index, so their yield is a real yield: the return you earn above inflation. Over the same months the 10-year breakeven inflation rate narrowed. That rate is the gap between the nominal and TIPS yields. It moved from around 2.5% toward roughly 2.1%.
So the move was close to pure real-rate repricing. Markets were not asking for more compensation against future inflation. They were pulling forward the date when the Fed would stop holding real rates deeply negative.
Assets reacted to that specific leg. Gold pays no coupon, so a negative real yield had made it cheap to hold. Gold fell about 23% in the second quarter of 2013. Emerging-market currencies that relied on foreign portfolio inflows sold off hard, and the "Fragile Five" label arrived that summer. Each of these moves followed from the real-yield leg. A breakeven-led rise of the same size would have sent different signals through the same markets.
The practical point is this: when you see a large move in the 10-year, find out which component caused it before you decide what it means for your other positions.
How a nominal yield splits into two prices
A nominal Treasury pays fixed dollars. Its yield has to pay you for two things: the real return you want for lending money over ten years, and the purchasing power inflation will take from those fixed dollars. A TIPS bond strips out the second item because its principal rises with CPI. Putting the two bonds side by side separates the components.
Breakeven = Nominal yield - TIPS real yield
Here is a worked example using today's nominal level. The 10-year Treasury stood at 5.31% on October 5, 2026. We have not pulled the matching TIPS yield for this article, so treat the real-yield figure below as an illustrative input, not a market observation. Suppose the 10-year TIPS yields 2.80%.
Breakeven = 5.31% - 2.80% = 2.51%
The bond market is then pricing ten years of inflation averaging about 2.5% per year. If realized CPI inflation beats 2.51%, the TIPS holder comes out ahead. If it falls short, the nominal holder wins. That is where the term "breakeven" comes from.
Now apply the same arithmetic to a move. Say the nominal yield rose 50 basis points to reach 5.31%, from 4.81%. A basis point is one hundredth of a percentage point. Two scenarios produce the same 50bp headline:
- Real-led: TIPS yield up 45bp, breakeven up 5bp. This is monetary tightening. The cost of capital after inflation went up.
- Breakeven-led: TIPS yield up 5bp, breakeven up 45bp. This is an inflation repricing. The real cost of money barely changed. Lenders are simply demanding protection against higher prices.
A rate-sensitive portfolio looks at these two moves and sees identical losses on its nominal bonds. Almost everything else in the portfolio sees two different events.
When you watch a rates move, break it into these two legs straight away. A 50bp rise from tightening and a 50bp rise from inflation repricing call for different hedges.
Why the split exists at all
The breakeven is not a survey of inflation forecasts. It is a market price, and specific actors with specific incentives hold it near expected inflation.
The first group is relative-value desks working the inflation swap market. An inflation swap exchanges a fixed rate for realized CPI. When the breakeven implied by Treasuries and TIPS drifts far from the swap rate, a dealer can buy the cheap leg and hedge with the swap. That trade pulls the two back together, within the limits of balance-sheet cost.
The second group is real-money investors who choose between the two bonds. Pension funds, insurers, and liability-driven investors with inflation-linked obligations (benefits tied to cost of living, for example) shift between nominals and TIPS according to whether the breakeven looks cheap or rich against their own inflation outlook. Their flows push the breakeven toward the consensus inflation path.
The third group is the central bank, which controls the other leg. Through the policy rate and the expected path of that rate, the Fed largely sets the real yield at the front of the curve. Expectations about how long it will hold that stance carry the effect out to ten years. That makes real yields the transmission channel for policy. Breakevens become the scorecard for whether markets believe the policy will hold inflation down.
The breakeven is not a clean inflation forecast. It contains expected inflation, plus an inflation risk premium (extra pay for the chance that inflation surprises upward), minus a liquidity premium. TIPS trade less actively than nominal Treasuries, so holders want a little extra yield, and that extra yield makes the breakeven look lower than true expectations. In calm markets these adjustments are small and fairly stable. In stressed markets they are neither.
Read a breakeven as expected inflation net of two premia. Most of the time the premia are background noise. In a crisis they can dominate the number.
When the breakeven lies
The mechanism fails most clearly when the people who enforce it lose balance-sheet capacity.
March 2020 is the cleanest example. In the dash for cash, dealers and leveraged funds sold everything that was not a nominal Treasury bill. TIPS were among the hardest assets to sell. The 10-year breakeven fell to around 0.5% in mid-March. That figure did not reflect a belief in near-zero inflation for a decade. It reflected a market where the liquidity premium on TIPS had blown out. Anyone who read that number as a deflation forecast misread a plumbing failure.
Late 2008 went further. After Lehman Brothers failed and its holdings were liquidated, short-dated breakevens turned sharply negative. The 5-year briefly priced deflation of roughly 2% per year. The arbitrage that normally caps such dislocations needs dealers willing to hold the cheap bond. In 2008, no one had the capacity.
There are quieter distortions too. TIPS principal accrues against CPI with about a three-month lag, and the reference index is not seasonally adjusted. As a result, short-maturity breakevens move with the monthly CPI calendar in ways that say little about the medium-term inflation outlook. Central bank purchases of TIPS, as in 2020 and 2021, can also push real yields down for reasons unrelated to private-sector expectations.
When breakevens collapse at the same moment credit spreads widen and funding markets seize up, assume the liquidity premium is moving, not expectations. Trust the 5-year forward and the inflation swap market over the cash breakeven until conditions calm down.
Reading the split in a 5.31% world
The current setup is a 10-year at 5.31%, a 2-year at 4.84%, and a 2s10s spread of +0.47% as of early October 2026. A positive slope at this yield level points to a long end that is selling off faster than the front end. That pattern is called a bear steepener. It can come from two sources, and the two point in opposite directions.
If real yields are doing the work, this looks like a repeat of 2013 or October 2023. In October 2023 the 10-year briefly touched 5% and the 10-year TIPS yield rose to about 2.5%, its highest level since 2007. Under that reading, the market is demanding a higher real return to hold long-dated government debt, possibly because of supply or term premium rather than the Fed. The second-order damage falls on assets valued on distant cash flows: unprofitable growth equities, gold, real estate investment trusts, and dollar-funded emerging markets. A higher real yield also tends to strengthen the dollar, which tightens financial conditions abroad even if the Fed does nothing.
If breakevens are doing the work, the transmission is different. Commodities, energy producers, and companies with pricing power can hold up or gain. TIPS outperform nominals of similar maturity. Gold may rally alongside the bond selloff instead of falling. The Fed's response function also changes: a breakeven-led selloff at 5.31% is a credibility problem for the central bank, while a real-led one is the market tightening on its behalf.
We do not have the current split in hand, so we will not claim which regime this is. The CPI index stood at 334.1 in August 2026. That figure is the input TIPS principal accrues against. It will tell you what realized inflation has done, not what the market expects next. The decisive variable is the relative performance of inflation-protected and nominal Treasuries of similar duration.
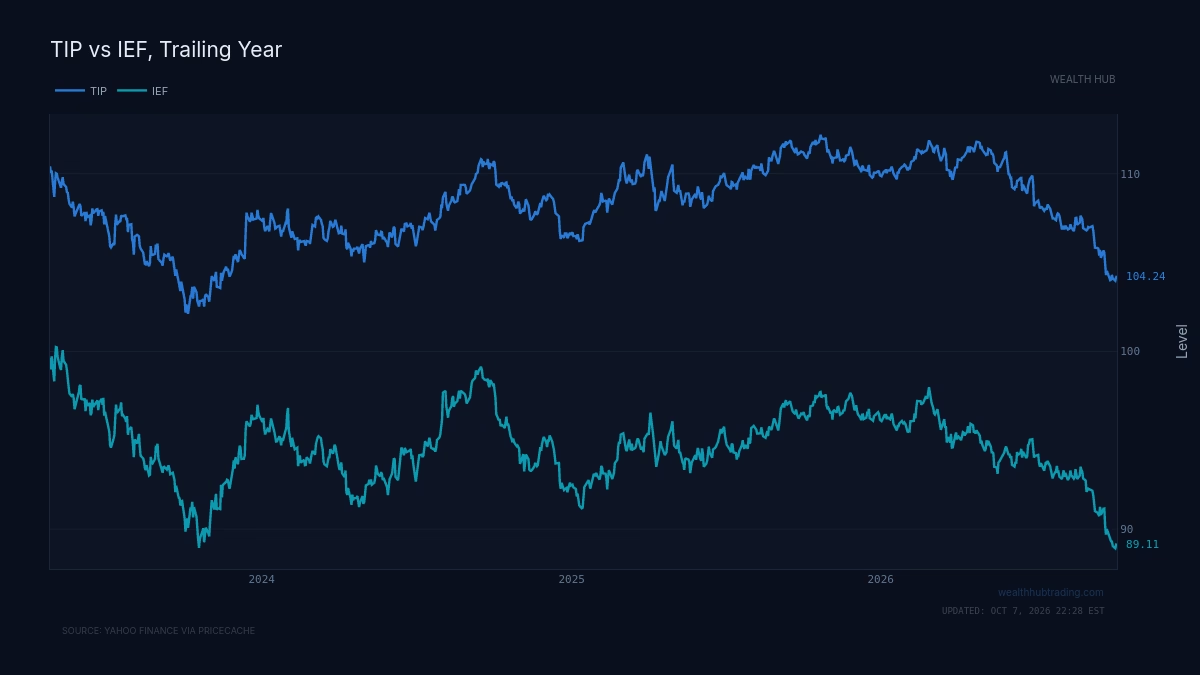
The chart compares an inflation-protected Treasury fund with a nominal intermediate Treasury fund. The two have broadly similar interest-rate sensitivity. When they move together, real yields are driving rates and the inflation leg is quiet. When the TIPS fund pulls ahead, breakevens are widening. The gap between the two lines is the breakeven move shown in price terms.
What to do with the decomposition
The mechanism in one sentence: a nominal yield is a real yield plus a breakeven, and the leg that moves determines which assets are repriced next.
In practice, every rates headline should send you to one more data point before you act on it. Before you treat a selloff as bad for gold, bad for growth stocks, or good for the dollar, check whether the 10-year real yield rose by most of the nominal move. If it did, the 2013 playbook applies: protect duration-sensitive equity, expect pressure on non-yielding assets, and watch dollar funding stress in emerging markets. If the breakeven carried the move, your bond losses are real but your inflation-sensitive holdings are probably your hedge, not a second source of loss. When breakevens collapse during a liquidity crunch, do not read deflation into a plumbing failure.