The most dangerous seller in a stock and bond selloff is often not a panicked human. It is a volatility-targeting rule doing exactly what it was designed to do, at the same time as every other book built on the same rule.
The year the hedge became the trade
In 2022 the S&P 500 lost about 18% on a total-return basis. The Bloomberg US Aggregate bond index lost about 13%, its worst calendar year on record. Those two numbers together broke a premise that had held for most of the prior two decades: when stocks fall, high-quality bonds rise and cushion the portfolio.
Inflation broke it. With consumer prices running far above target, the Federal Reserve raised rates aggressively. That one force pushed bond prices down and equity valuations down together. Stocks and bonds stopped being two trades and became one trade, short inflation surprise.
For a traditional 60/40 portfolio, meaning 60% equities and 40% bonds held without borrowing, 2022 was a painful year. For strategies that borrow to hold more bonds than they have capital, it was a mechanical event. The losses were bad, and the rule then required those strategies to sell into them. To understand why, you have to see how the allocation is built.
How a risk parity book is built
Risk parity is an allocation method that sizes each asset class so it contributes an equal share of total portfolio risk, rather than an equal share of capital. Risk here means volatility, the annualized standard deviation of returns, a measure of how widely an asset's price swings.
Equities are far more volatile than Treasuries. A 60/40 portfolio looks balanced by dollars, but equities typically drive roughly 90% of its risk. Risk parity rejects that. It holds a smaller equity weight and a much larger bond weight, then applies leverage, borrowing through futures or repo, so the whole portfolio reaches a return target that unlevered bonds could not deliver alone.
The core sizing rule for two assets is simple. Each asset's weight is proportional to the inverse of its volatility:
Weight(i) = (1 / σᵢ) / Σ(1 / σⱼ)
Then the book is scaled to a volatility target, a fixed level of expected portfolio swing such as 10% a year:
Leverage = Target volatility / Unlevered portfolio volatility
Both inputs are estimated from trailing data, usually weeks to months of realized returns. That detail matters more than anything else in this article, because it means the allocation responds to what markets have just done.
The practical implication: a risk parity fund's bond holdings are not a conservative ballast position. They are the levered engine of the strategy.
Why the negative correlation was supposed to hold
The strategy works when stocks and bonds hedge each other. That relationship is economic before it is statistical. Its behavior depends on which kind of shock dominates.
In a demand shock, growth slows and inflation falls together. Earnings expectations drop, so equities fall. The central bank cuts rates, so bond prices rise. The stock-bond correlation, a measure from -1 to +1 of how closely two return series move together, turns negative. From roughly 2000 to 2021, demand shocks dominated and inflation stayed anchored near target. In that world, holding levered bonds against equities was close to free diversification.
There is a second reason the strategy earned its keep. Many investors, such as pension funds facing liability rules and retail accounts facing margin limits, cannot or will not borrow. To reach higher returns they buy more volatile assets directly. That bids up high-risk assets and leaves low-risk assets offering better return per unit of risk. Risk parity harvests that gap by borrowing against the low-risk asset. Academic work on the low-risk anomaly, notably Frazzini and Pedersen's research on leverage aversion, frames this as compensation for being willing to use leverage.
A supply shock reverses everything. When inflation rises while growth slows, as in an energy shock or a post-stimulus overheating, the central bank tightens into weakness. Bonds fall because rates rise. Equities fall because discount rates rise and margins compress. Correlation turns positive. The 1970s ran largely in this regime, and 2022 brought it back.
What this means for you: the stock-bond correlation is a regime variable, set by whether inflation or growth is the market's main fear. It is not a constant you can extrapolate from a backtest.
The arithmetic of a forced exit
A worked example makes the mechanism concrete. These are illustrative inputs, chosen to sit near typical long-run levels.
Start in a calm regime: equity volatility 16%, Treasury volatility 7%, stock-bond correlation -0.3, volatility target 10%.
Inverse-volatility weights give equities 7/23, about 30.4%, and bonds 16/23, about 69.6%. Each sleeve's volatility contribution is about 4.87 points. Unlevered portfolio variance is 4.87² + 4.87² + 2 × (-0.3) × 4.87 × 4.87, about 33.2, so unlevered volatility is about 5.76%.
Leverage = 10% / 5.76% ≈ 1.74x
The fund holds about 53% of capital in equities and about 121% in bonds. Total gross exposure is 174%.
Now inflation arrives. Bond volatility climbs to 10% and the correlation flips to +0.5. Before anything is traded, the existing book's volatility jumps to roughly 17.9%, almost double the target. The rule now does two things.
It reweights toward the new volatility mix: equities 10/26, about 38.5%, and bonds about 61.5%. Unlevered volatility on those weights is about 10.65%, because the positive correlation strips out the diversification benefit.
Leverage = 10% / 10.65% ≈ 0.94x
The new book holds about 36% in equities and about 58% in bonds. Gross exposure falls from 174% to 94%. The fund must sell more than half its bond position and about a third of its equities, and it must do so after both have already dropped.
The deleveraging comes from the correlation change, not the losses. A fund that suffered no drawdown at all would still cut gross exposure almost in half, because the hedge that justified the leverage stopped working.
The practical implication: in a correlation flip, risk parity is a forced seller of both assets at once, and the size of the sale scales with how much leverage the calm regime allowed.
Same rule, same assets, same week
One fund running this arithmetic is a footnote. The problem is that the rule is shared.
Risk parity books at different managers use different lookback windows and target levels, but they estimate risk from the same market data and trade the same liquid instruments: equity index futures, Treasury futures, and sometimes commodity and inflation-linked sleeves. When realized volatility and correlation shift, their signals shift in the same direction. Diversification by construction becomes concentration by crowding.
Industry estimates of assets running explicit risk parity vary widely, and the dollar figure is not verified here. The more important point is that the logic extends beyond funds with "risk parity" on the label. Volatility-targeting funds scale exposure down when realized volatility rises. CTAs, commodity trading advisors that follow price trends, cut long positions as trends turn negative. In a stock-bond selloff all three groups lean the same way. How much of any single week's move each group explains cannot be measured from public data. The direction of their pressure, however, follows directly from their rules.
The trailing estimation windows also shape the timing. Because volatility and correlation are measured over weeks or months, the selling does not arrive in one session. It continues as each new bad day enters the window, which helps explain why stock-bond selloffs can grind for weeks rather than gap and recover. The 2013 taper tantrum showed a smaller version: after Ben Bernanke signaled in May that bond purchases could slow, the 10-year yield rose by roughly 100 basis points in about two months, and risk parity strategies were widely reported as sellers of both Treasuries and equities through June.
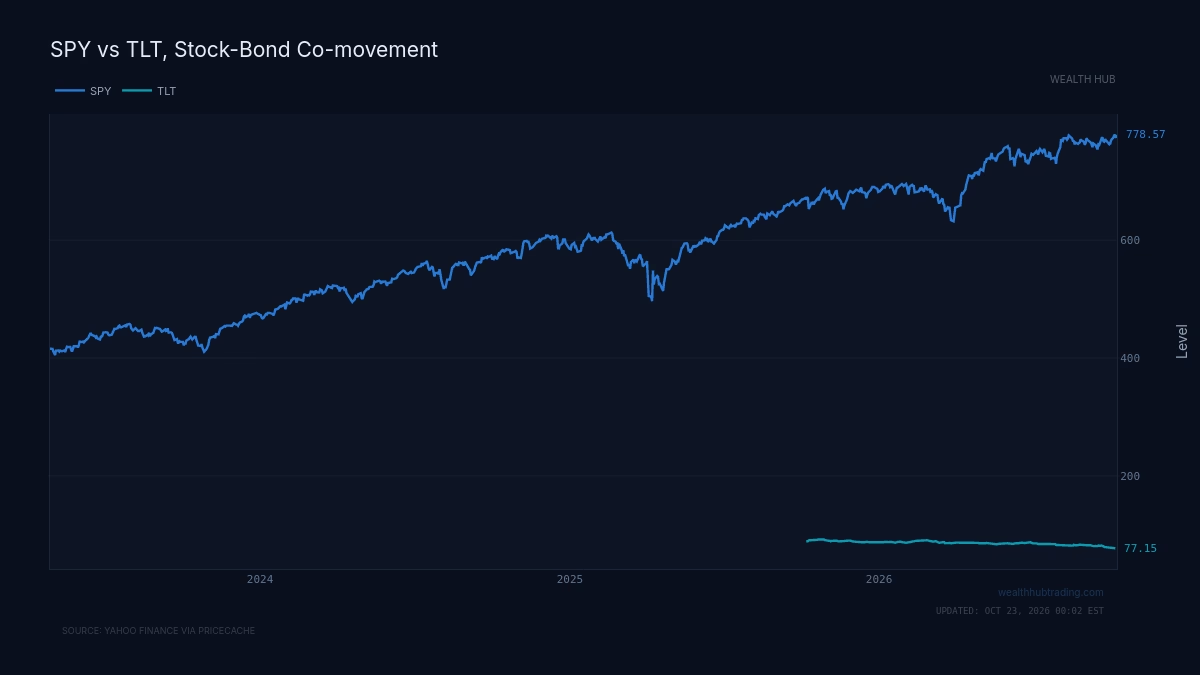
What this means for you: when stocks and bonds fall together for more than a few sessions, assume a mechanical seller is still working through its book, and do not read the first bounce as the end of the flow.
When the cascade does not happen
The mechanism has clear limits, and misapplying it leads to bad calls.
A sharp equity selloff with falling yields is not a risk parity liquidation. If the shock is about growth, bonds rally and correlation stays negative. The rule then rebalances by buying equities to restore equal risk. Calling for forced selling in that regime gets the flow backward.
Liquidity events are a different animal. In March 2020, Treasuries briefly sold off alongside equities during the dash for cash, and levered books were hit. The trigger was a funding scramble, not inflation, and Federal Reserve intervention reversed it within weeks. Correlation flips driven by inflation tend to last longer because the central bank is part of the cause, not the cure.
Finally, deleveraging resets the system. Once gross exposure is cut, the forced seller is spent. A book at 0.94x has little left to sell, and as volatility settles, the same rule will rebuild leverage and become a buyer of the bonds it dumped. Late in a correlation shock, the flow can turn into support.
The practical implication: tie any risk parity flow call to the cause of the move. Inflation-driven correlation is the dangerous case; growth scares and funding spikes behave differently.
Reading the flow before the tape
The market watches the price of stocks and the price of bonds. The variable that drives risk parity flows is the relationship between them. A month in which both sell off on inflation data signals more future forced selling than a larger equity decline on a growth scare.
In practice, that means tracking three things: rolling stock-bond correlation, realized Treasury volatility, and how sensitive each asset is to inflation releases. When CPI surprises start moving equities and bonds in the same direction, the deleveraging arithmetic above has started, and the trailing windows guarantee it will continue for some time after the surprise.
Risk parity sizes positions on the assumption that bonds hedge stocks. When inflation removes that hedge, every book built on the assumption sells the same assets together, and that shared rule, more than the inflation print itself, decides how long the selloff lasts.