On the afternoon of December 5, 2024, the S&P 500 drifted in a quiet range for most of the session, then accelerated into the close with no headline to ...
On the afternoon of December 5, 2024, the S&P 500 drifted in a quiet range for most of the session, then accelerated into the close with no headline to explain the move. No economic release landed after 2pm. No Fed speaker crossed the wires. The move was mechanical. It was the sound of options dealers rebalancing hedges against contracts that would cease to exist by 4pm.
That afternoon is a clean illustration of a structural change most traders still read backwards. They look at the price and ask what the price is telling them about earnings, rates, or sentiment. The more useful question is what forced hedging flow is pushing the price around, because on any given afternoon that flow may be the largest marginal buyer or seller in the tape. Same-day expiry options, known as 0DTE (zero days to expiration), have made that flow larger, faster, and concentrated into the final hour.
What the December afternoon actually was
To see why the close moved, you have to know who was trading against whom. When a customer buys a call option that expires today, the market maker on the other side is now short that call. A market maker does not want a directional bet; the business is collecting the spread, not guessing the market. So the dealer offsets the risk by buying or selling the underlying index in an amount that neutralizes the option's directional exposure.
That offsetting amount is governed by two Greek letters. Delta is how much the option's value moves for a one-point move in the index. Gamma is how fast delta itself changes as the index moves. An option far from its strike price has stable delta and little gamma. An option sitting right at its strike price on expiration day has enormous gamma: a small move in the index flips the option from likely-worthless to likely-in-the-money, and delta swings from near zero to near one in minutes.
On December 5, a large cluster of 0DTE strikes sat near the index level as the afternoon wore on. As the index ticked up, dealers who were short those calls saw their delta exposure grow, and they bought index futures to stay neutral. That buying pushed the index higher, which grew their delta again, which forced more buying. The move fed itself. That self-reinforcing loop is the practical face of gamma, and 0DTE is what packed it into a single session.
The practical takeaway from that afternoon: when you see a trendless day resolve into a sharp directional close, your first hypothesis should be hedging flow, not new information.
Why same-day expiry changes the clock
Options hedging is not new. What is new is the timescale. Understanding the shift requires seeing what expiration compression does to the life cycle of a hedge.
A monthly option lives for weeks. The dealer short that option adjusts the hedge gradually as the index drifts and as time passes. Gamma is low because the option is usually far from its strike and far from expiry, so each day's rebalancing is small. The hedging flow is spread across many sessions and rarely dominates any single one.
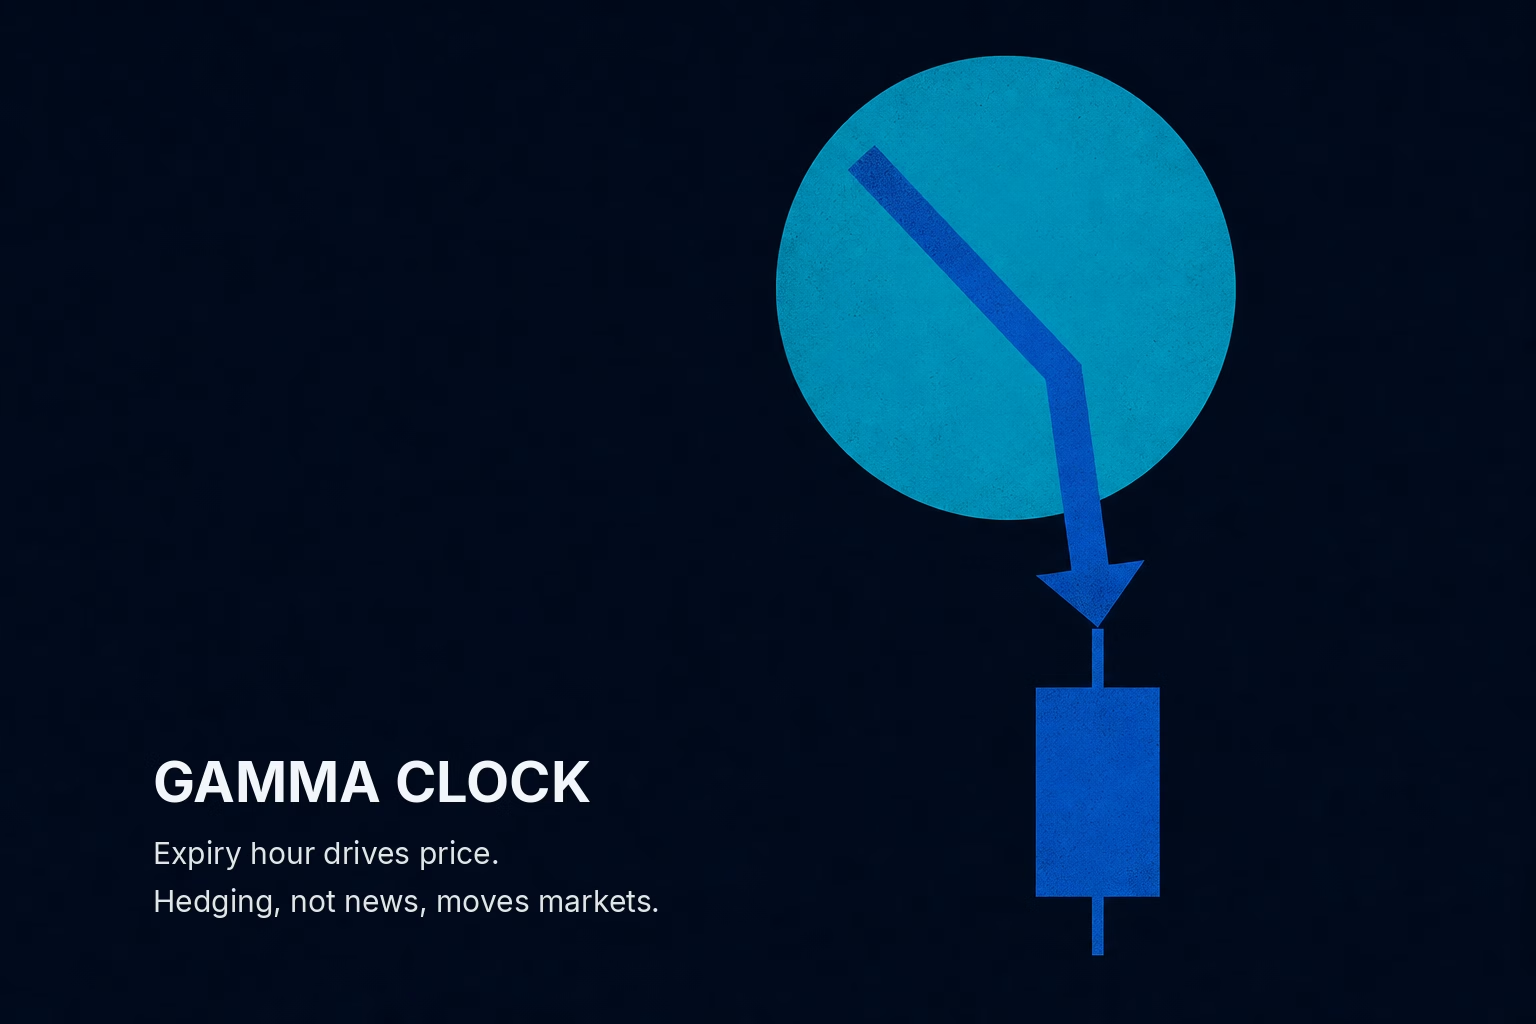
A 0DTE option lives for hours. Its entire time value decays within the session, and for much of the afternoon a meaningful share of open contracts sit close to their strikes. Gamma per contract is therefore high, and it climbs as the clock runs toward 4pm. The same customer position that would have produced a trickle of hedging over a month now produces a torrent over an afternoon.
The mechanism is the same one that has always governed dealer hedging. The change is that the entire arc, from position opening to expiry to final settlement, now completes before the closing bell. The horizon on which positioning gets decided has moved from the calendar month to the final hour of the trading day.
For your own routine, this means the intraday clock now carries information the daily chart hides. A flat day on the daily bar can contain a violent gamma-driven reversal in its last hour that never shows up if you only look at the open and close.
The two regimes: dealers who dampen and dealers who amplify
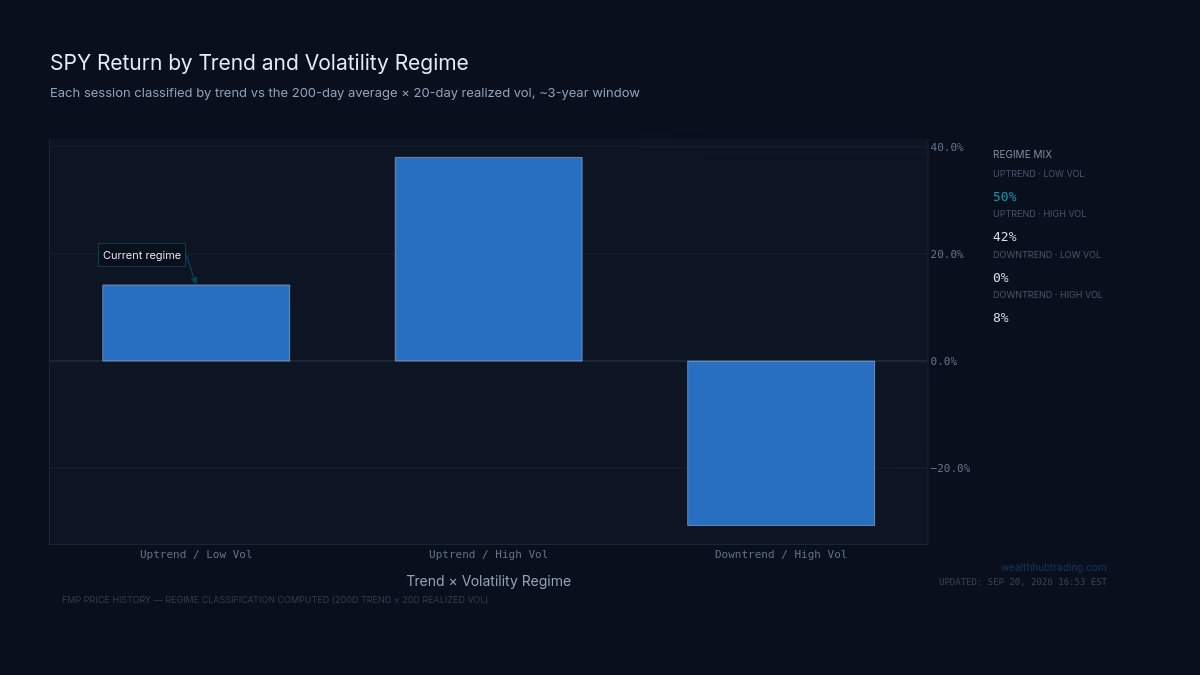
The direction of the hedging flow depends on whether dealers are net long or net short gamma, and this is the single most useful distinction for reading intraday tape.
When dealers are net long gamma, their hedging works against the market's move. A rising index makes their aggregate delta too long, so they sell into strength; a falling index makes them too short, so they buy into weakness. This is stabilizing. Ranges tighten, dips get bought, rallies get sold, and realized volatility stays low. Days feel orderly and mean-reverting.
When dealers are net short gamma, the sign flips and hedging reinforces the move. A rising index forces them to buy more, a falling index forces them to sell more. This is destabilizing. Small moves become large ones, ranges break instead of hold, and realized volatility spikes. The December 5 close was a short-gamma afternoon in miniature.
The reason 0DTE matters so much here is that its high gamma makes the sign of the dealer book unusually powerful. In a long-gamma session, 0DTE flow can pin the index near a heavily traded strike into the close, because every move away gets hedged back toward it. In a short-gamma session, the same flow can turn a modest afternoon drift into an outsized closing move.
The application is direct. Before you fade an intraday breakout, ask which regime you are likely in. Fading works in a long-gamma tape and gets run over in a short-gamma one.
Where the mechanism breaks
A mechanism is only useful if you know its limits, and the gamma-flow read has real ones.
The first limit is that dealer positioning is not directly observable. The public does not see the dealer book; it sees estimates built from exchange volume and open interest, and those estimates require assumptions about who initiated each trade. A model can misclassify the flow and hand you the wrong regime. The read is a probabilistic lens, not a data feed.
The second limit is that flow does not override information. When a genuine catalyst hits, an inflation surprise, a policy shift, a credit event, real money reprices the index and dealers hedge into a market that is already moving on fundamentals. The August 2024 unwind, when a crowded yen carry position blew out and volatility exploded, was not a gamma story; it was a forced-selling story that hedging merely accelerated. Do not attribute a fundamentally driven move to positioning just because positioning was present.
The third limit is speed. The stabilizing effect of long dealer gamma assumes dealers can rebalance continuously. When the index gaps faster than they can trade, the hedge falls behind and the dampening breaks down exactly when it is most needed. Structural stability is not the same as guaranteed stability.
The practical guard here: treat the gamma read as a filter on your other work, not a replacement for it. It tells you the likely character of the tape, not the direction of the next fundamental repricing.
What to actually do with this
Same-day expiry has compressed the option life cycle into one session, which concentrates dealer hedging into the afternoon and makes the final hour the horizon on which intraday positioning is resolved. That is the mechanism, stated in one sentence, and it matters because it changes what the price at 3:45pm is actually telling you.
The concrete change to your process is this: separate the two forces you see on the tape. Fundamental information reprices the index on any timescale and shows up across assets at once. Hedging flow moves the index intraday, strengthens into the close, and shows up as self-reinforcing acceleration or as pinning near a busy strike with no news to justify either. When you can tell which one you are watching, the last hour stops looking like noise and starts looking like a schedule.