A gasoline price shock does not hit households evenly, and the interesting part is not that low-income families spend more when prices rise. That is ari...
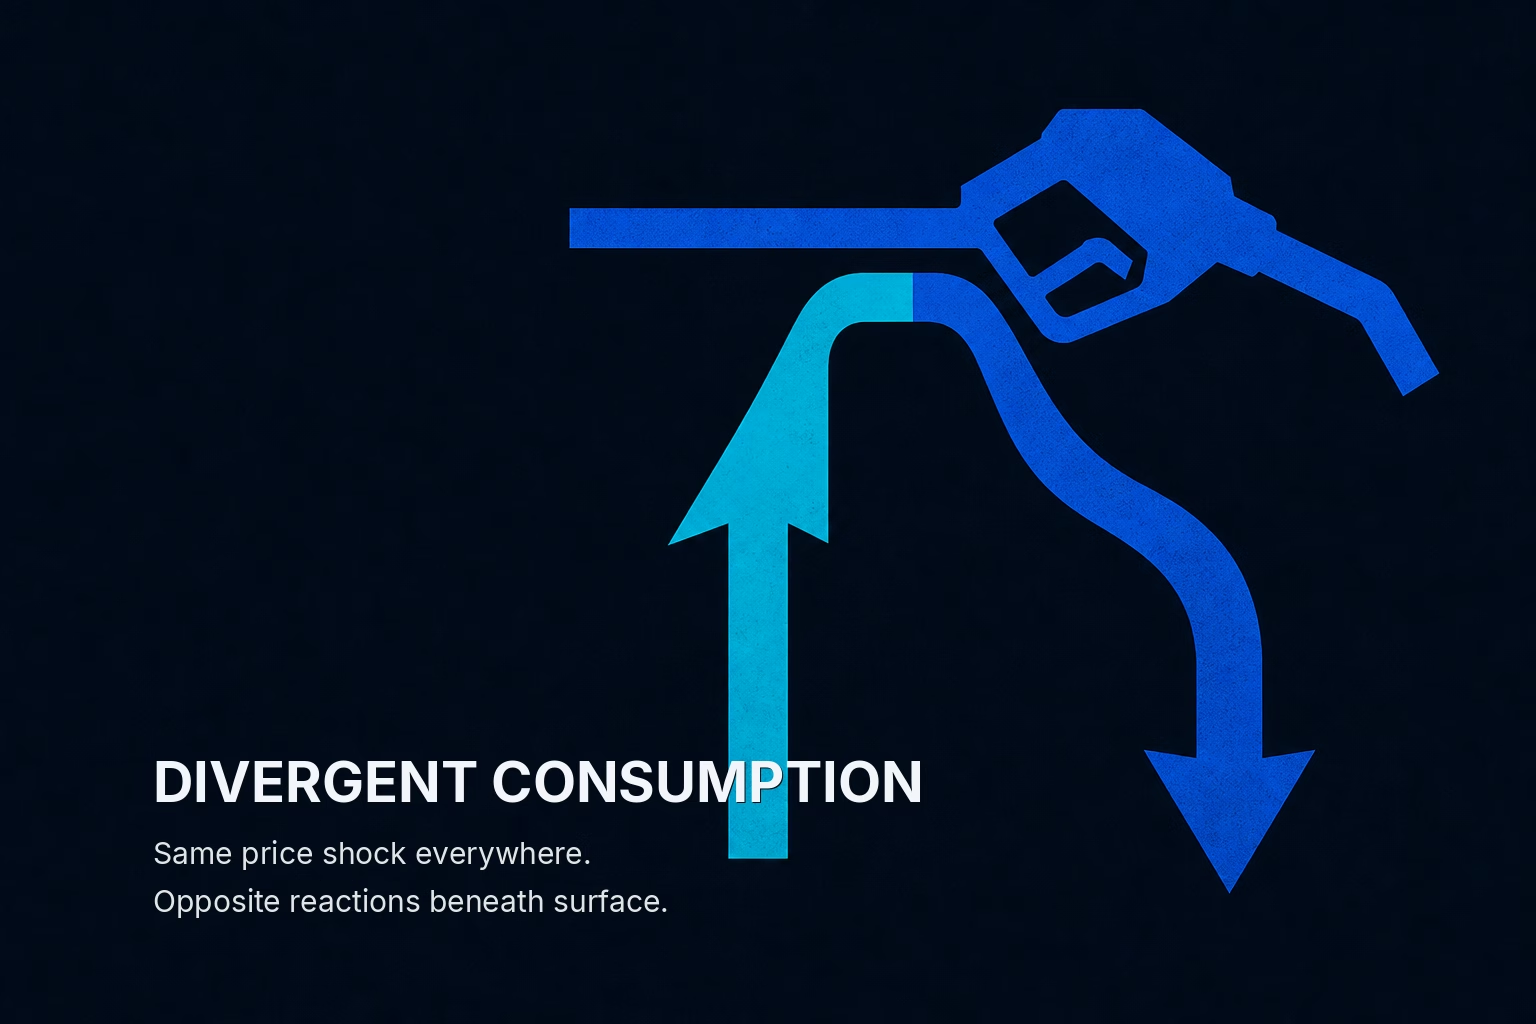
A gasoline price shock does not hit households evenly, and the interesting part is not that low-income families spend more when prices rise. That is arithmetic. The interesting part is that they consume less gasoline while high-income families keep filling the same tank, so the single aggregate number for "real gas consumption" is an average of two behaviors that point in opposite directions. In March 2026, with the Strait of Hormuz closed and pump prices at a four-year high, the top third of households by income held real consumption essentially flat while the bottom tier cut physical gallons. That is the K-shape, and it tells you something a headline CPI print never will: the same price is not the same shock.
The Number That Averages Away the Story
Start with the aggregate, because it is what most people see. Nominal spending at gas stations in the Numerator panel rose more than fifteen percent in March, moving from roughly ten percent below the January 2023 baseline to about five and a half percent above it. Independent retail-sales data recorded a nearly identical jump of 14.5 percent. So spending clearly surged.
But real consumption fell about three percent. Both statements are true at once, and the reconciliation is entirely price: households paid more for less. If you stopped here you would conclude that Americans tightened their gasoline use modestly in the face of a shock. That conclusion is not wrong so much as it is a composite portrait of people who do not exist. Nobody experienced the average.
The value of splitting the panel by income is that it separates the price effect from the quantity effect, and the two effects sort cleanly along income lines. Nominal spending rose across all three groups, because everyone pays the posted price. Real consumption is where the groups diverge.
Why the Poor Cut Gallons and the Rich Do Not
The mechanism is income elasticity of a near-necessity under a budget constraint. Gasoline is not optional for most working households; it is the cost of getting to work. When its price jumps, a low-income household faces a hard constraint. The fuel bill is a large enough share of the budget that paying the higher price in full would crowd out other spending it cannot compress further. So it does the only thing available: it drives less. Fewer discretionary trips, more trip-chaining, some substitution away from the car where possible. Real consumption falls.
A high-income household faces the same posted price and the same percentage increase, but the fuel bill is a small enough share of its budget that absorbing it requires no behavioral change. The extra dollars come out of savings or discretionary slack, not out of the number of miles driven. Real consumption holds flat. This is not a story about preferences or attitudes toward the shock. It is a story about who has the balance-sheet room to treat a price increase as a nuisance rather than a decision.
That asymmetry is the whole mechanism, and it produces the counterintuitive result: measured real gasoline consumption grows faster for high-income households than for low-income households during a price spike. The group with more money consumes relatively more of the thing that just got expensive, precisely because the price increase does not bind them. Consumption growth becomes a proxy for who was insulated.
The 2022 Rhyme, Only Louder
This pattern is not new. The same qualitative structure appeared at the start of the Russia-Ukraine war in spring 2022, when energy prices last spiked hard. High-income real consumption held; lower-income real consumption gave way. The March 2026 episode rhymes with it.
What matters is that the gap this time is quantitatively larger. The distance between the income groups' consumption trends is wider than it was in 2022. That is the finding worth sitting with. If the divergence were merely repeating at the same magnitude, you could file it as a stable feature of how energy shocks transmit. A wider gap suggests the cushion protecting lower-income households has thinned, or that the shock itself was sharper, or both. A four-year high in prices arriving on top of several years of accumulated cost-of-living pressure leaves less slack to absorb the next hit. The K does not just reappear; its arms spread further apart.
Where This Read Could Be Wrong
The honest counterargument is measurement. Spending at gas stations is a proxy for gasoline consumption, not a direct meter of gallons. Gas stations sell coffee, cigarettes, lottery tickets, and snacks, and the mix of station-store purchases differs by income. If high-income households buy more non-fuel items at the pump, some of their "consumption" resilience could be convenience-store spending rather than gasoline itself. The authors deflate each income group by a demographic-specific gasoline price, which sharpens the read considerably, but the underlying series is still store spending, not metered fuel.
There is a second caveat. A single month is a data point, not a trend. March 2026 was an acute shock tied to a specific geopolitical event. Real consumption that fell three percent in aggregate could rebound as prices normalize, and the income divergence could narrow with it. The K-shape is a description of the shock's incidence, not a permanent structural claim about American driving.
Neither caveat overturns the core reading. The proxy concern would have to be large and income-correlated in a very specific way to manufacture the entire divergence, and the 2022 precedent argues against a one-month fluke. But both are the right places to look if you want to break the thesis.
What Would Confirm It, and Why It Matters Beyond the Pump
The clean confirmation is durability. If the consumption gap between income groups persists through April and May as prices stay elevated, the budget-constraint mechanism is doing exactly what the theory predicts, and the wider-than-2022 gap is a real signal about thinning household cushions rather than a measurement artifact. If the gap collapses the moment prices ease, the shock was absorbed and the story was transient.
The reason this reaches past gasoline: a supply-driven energy shock functions as a regressive tax. It extracts real consumption from the households least able to give it up and leaves the top third's behavior untouched. Aggregate consumption statistics smooth this over, which means policymakers reading the average will systematically understate the distributional damage of an energy spike. The same headline number that looks like a manageable three percent dip in real consumption is, underneath, a full-flat top and a bending bottom. Anyone trying to read the health of the consumer from a single line is reading an average of two economies, and in an energy shock those two economies are moving apart.