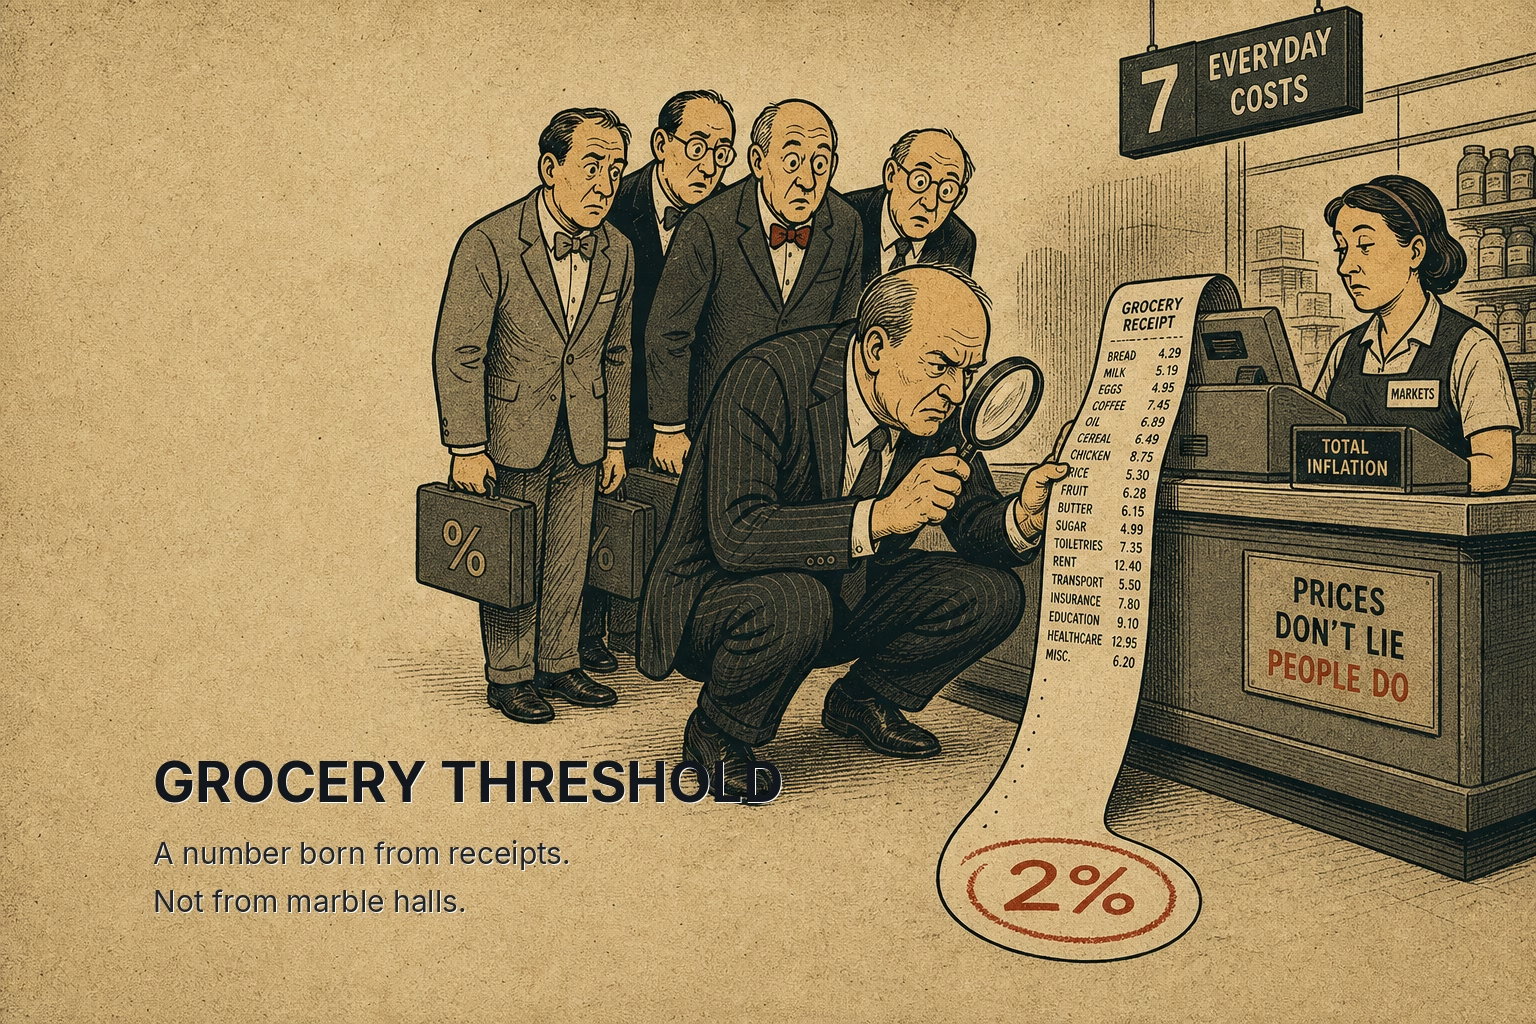
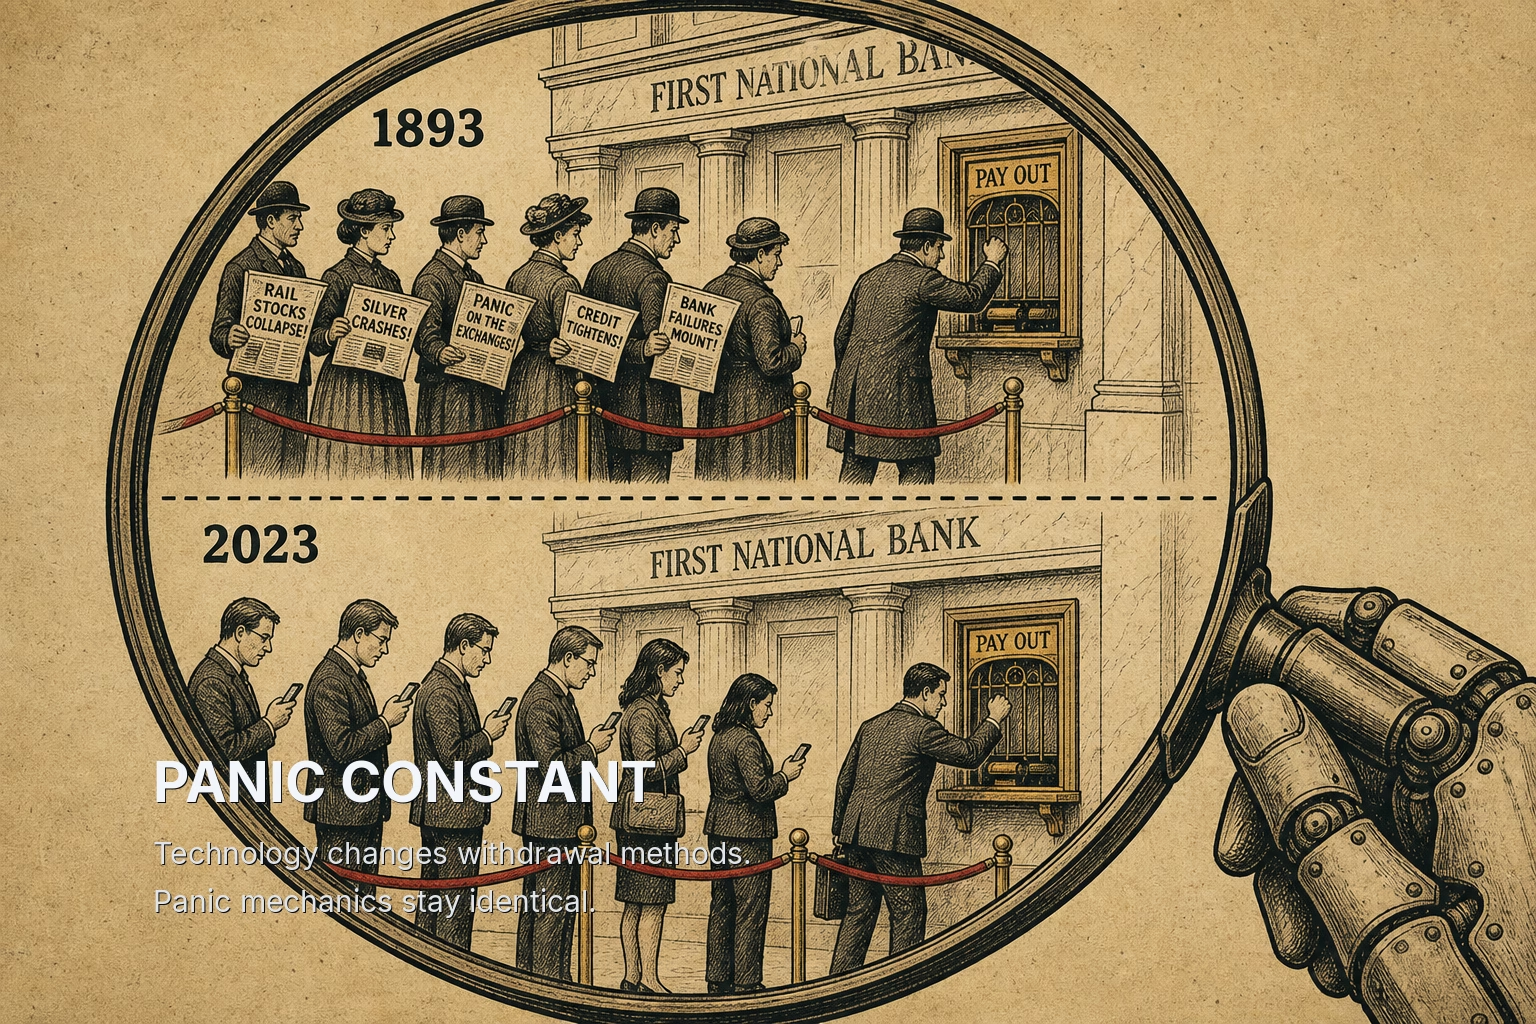
The record profit margin is the least informative number in this debate. Across the prior episodes when producer prices ran away from consumer prices, the squeeze rarely arrived as a clean drop in the headline profit share. It arrived as a split. Companies that sold to households with shrinking real paychecks cracked first. Companies with funded customers and contractual pricing carried the aggregate for a while longer. What the 2026 setup lacks is the thing that rescued margins in every escape since the 1950s: a balance sheet willing to fund the household. This time the money is flowing to data centers, not to shoppers.
October 2026: The Number Underneath The Headline
On October 15, 2026, the Bureau of Labor Statistics released its September producer price report, and most of the market looked past it. The Consumer Price Index had printed 3.7% a year, which was uncomfortable but familiar. The Producer Price Index for final demand rose 1.3% in a single month, the largest monthly gain since March 2022, and the annual rate reached 6.3%. Lance Roberts, writing for RealInvestmentAdvice.com, framed the 2.6-point PPI vs CPI gap as a measure of who was paying for inflation, and his answer was corporate America.
Further up the pipeline, the numbers were harsher. Processed goods for intermediate demand were up 14.1% from a year earlier, and unprocessed goods were up 21.5%. Energy did most of the September damage, with final demand energy prices up 10.8% in one month. These are the costs that had not yet reached a store shelf. By the time they passed through refiners, manufacturers, carriers and retailers, consumer prices were rising at less than 4%. The difference was being absorbed somewhere along that chain.
Corporate profitability had seldom been better prepared to absorb it, at least on paper. After-tax corporate profits reached 13.1% of GDP in the second quarter, the highest reading since 1947 and nearly double the 7.4% long-run average. FactSet's blended third-quarter S&P 500 earnings growth stood at 30.2% with 60% of companies reported, and analysts expected 28.4% for the fourth quarter. The aggregate earnings surprise, though, was just 1.9%, the smallest since late 2022. Beats were still arriving. They were getting thinner.
The decision environment, then, looked like this. Participants knew costs were rising faster than prices. They also knew margins sat at records, and they read the records as proof of pricing power. The historical question is whether that inference has held in comparable moments.
The Pattern The Long Series Describes
Roberts went back to the PPI for all commodities, which runs from 1947, and counted six episodes since 1950 in which producer inflation outran consumer inflation by four points or more. In four of them, the corporate profit share of GDP fell between 1 and 4.4 points within two years. He was candid that the statistical relationship across all quarters was negative but modest. The big gaps told the clearer story.
The two exceptions are the more instructive half of the record. Between 2004 and 2006, producer costs surged on oil and metals, and margins held because households were spending money they had borrowed against their homes. Mortgage equity withdrawal was, in effect, a private stimulus program, and it let retailers and manufacturers pass costs forward to customers who did not yet feel the strain. In 2010 and 2011, commodity prices rebounded hard from the crisis lows, and margins again held, this time because employment was recovering and the Federal Reserve's balance sheet was lifting asset prices and credit conditions. In both cases the consumer's ability to pay higher prices was funded from somewhere outside the paycheck.
The structural lesson is narrower than "producer inflation kills margins." The gap often damages margins when the customer at the end of the chain cannot finance the higher price. When someone funds that customer, the gap has sometimes passed through without much harm.
1973 and 1974: When Reported Profits Hid The Squeeze
The archetype of a cost shock meeting an unfunded consumer is the mid-1970s, and while the source does not list which episodes make up its six, the period is the obvious textbook case. The oil embargo began in October 1973. Wholesale prices accelerated far faster than retail prices, Nixon-era price controls were dismantled in April 1974, and real wages fell as fuel and food costs climbed. The S&P 500, which had closed at 120.24 in January 1973, fell to 62.28 by October 1974.
What makes the episode useful today is not the drawdown. It is the accounting. Reported corporate earnings in 1974 looked far healthier than the underlying businesses, because companies carrying inventory bought at old prices booked large gains as replacement costs rose. Those inventory profits flattered the income statement for several quarters while the true margin on new production was shrinking. The market eventually priced the real number rather than the reported one, and it did so before the profit data confessed.
That rhyme deserves attention in 2026. Roberts notes that the record 17.0% second-quarter S&P 500 net margin was inflated by one-time valuation gains at Alphabet and Amazon, and that the blended third-quarter margin had already slipped to 14.9%. A record built partly on non-recurring items, measured before September's energy jump, is a record that describes the past. Margins are a lagging measure. They tell you a company had pricing power, not that it still does.
2022: The Split Between The Aggregate And The Shelf
The most recent episode is also the one most investors remember least accurately. In 2021 and 2022, the PPI vs CPI gap was wider than today's. Aggregate corporate profitability stayed very high through much of that period, which is why many observers now cite 2021 as evidence that companies can pass through anything. That reading skips over what happened inside the index.
In March 2022, the month producer prices posted the monthly gain that September 2026 has just matched, Target had told investors it expected to hold an operating margin around 8% for the year. The company had just finished a record holiday season, and the frame was reasonable on the data then available. Demand was strong, households still held excess savings from the pandemic transfers, and the retailer had pricing power on paper. Freight, fuel and inventory costs were moving the other way.
Two months later, on May 18, 2022, Target reported first-quarter results in which those costs had overwhelmed the margin, and its shares lost roughly a quarter of their value in a single session. A day earlier, Walmart had cut its profit outlook for similar reasons. A further warning in June pushed Target's near-term margin expectations lower still. The company's full-year operating margin for fiscal 2022 came in less than half the level of the prior year.

The analyst holding an index-level view in May 2022 saw record aggregate margins and concluded pricing power was intact. The analyst watching a mass-market retailer saw the same producer price data and concluded that the cost was landing on companies whose customers had begun to trade down. Both were looking at the same PPI report. The first framed it as an inflation signal that profits could ride. The second framed it as a margin signal for the businesses that sat between commodity inputs and a household budget. The second frame was correct for the companies it described, and the aggregate disguised that for a while because the index was carried by energy producers and firms on the receiving end of higher prices.
Retailers with membership-fee models and businesses selling into inelastic demand weathered the same period with far less damage. The gap did not hit everyone equally. It hit the businesses that bought commodities and sold to stretched consumers, which is precisely the distinction Roberts draws for 2026.
There is one more detail from 2022 that matters for the present. The households absorbing those price increases still had a cushion. Stimulus checks, enhanced unemployment benefits and accumulated lockdown savings funded a great deal of 2021 spending. Even with that cushion, the consumer-facing part of the market cracked within weeks of producer inflation cresting. The 2026 consumer is entering a similar cost shock without the cushion at all.
What Is Different This Time, And What Is Not
The 2026 setup matches the losing episodes on the consumer side and resembles the escapes on the corporate side, and that combination points toward a split rather than an index-wide collapse.
On the consumer side, the funding that rescued 2004 to 2006 and 2010 to 2011 is absent. Real average hourly earnings fell 0.7% over the past year. Retail sales rose 0.8% in September and 6.3% from a year earlier, which reads as strength until gasoline is removed; excluding gas stations, September spending rose just 0.2%. That is the signature of what Roberts calls bad inflation, a supply shock that raises the bill without raising the paycheck. Home equity is not being tapped the way it was in 2005, and the central bank is not buying bonds the way it was in 2010. Two Fed officials, Lisa Cook and Beth Hammack, dissented in favor of a hike when the Fed held rates on October 28.
On the corporate side, there is a funded customer, but it is not the household. The AI capital spending boom is generating real demand for chips, power and construction, and it supports pricing power in the sectors driving index earnings. This is the one way 2026 does not rhyme with the losing episodes. A meaningful share of S&P 500 profits now comes from companies whose customers are other corporations spending from balance sheets and capital markets, not consumers spending from wages.
That distinction cuts in a specific direction. It means the aggregate profit share can stay elevated for longer than the 1974 template suggests, because the companies carrying index earnings are on the funded side of the gap. It also means the consumer-facing businesses face a setup closer to Target's in spring 2022, with the cushion removed. If the historical pattern holds in its 2022 form, the first evidence of a squeeze will appear in company guidance from retailers, packaged-goods firms, restaurants and freight-dependent manufacturers, not in a decline in the national accounts profit share. The national accounts will confirm it last.
The valuation side turns on the rate channel, which is why the bond market belongs in this argument. With the 10-year Treasury yield at 4.86% and the 2-year at 4.51% as of November 6, an S&P 500 at 19 times forward earnings implies an earnings yield only modestly above what a Treasury pays with no margin risk at all. That thin premium is being paid on earnings that assume record margins persist through an energy shock. In 1974, the discount rate rose as the margin assumption failed, and both moves hit the multiple at once. A repeat is not required for the arithmetic to be uncomfortable; the cushion between the earnings yield and the risk-free yield is already narrow.
The early warnings in this episode are concrete. The fourth-quarter earnings growth estimate had slipped from 28.6% to 28.4% in two weeks, a small move, but estimate revisions have often led the reported profit data by a quarter or more. The thinning earnings surprise, at 1.9%, is another. Guidance language matters more than the beat itself: a company beating lowered estimates while citing freight, fuel and input costs for the next quarter is describing the squeeze in real time, the way Walmart and Target did in May 2022.
The bulls' case has genuine substance. Companies are beating estimates at an 82% rate, AI demand is real, and leaning defensive too early carried a cost in 2021, when margins held a year longer than skeptics expected. The historical record does not say the squeeze arrives next quarter. It says the squeeze arrives when the household can no longer fund the price, and the wage data says that point is closer than the earnings estimates assume.
The Sequence That Repeats
Across these episodes, the sequence has tended to run in the same order. Raw input costs surge first, and the pipeline data shows them weeks or months before the shelf does. Reported profits stay strong, sometimes flattered by inventory gains or one-time items, and the record is read as proof of pricing power. The companies closest to an unfunded consumer guide down, often abruptly, while the aggregate still looks healthy. The aggregate follows only if the squeeze spreads beyond them, and it does not always spread.
The pattern does not turn on the size of the PPI vs CPI gap. It turns on whether anyone is funding the final buyer. In 2005 the funding was home equity, in 2010 it was the Federal Reserve, and in 2021 it was the Treasury. In 2026 the funding exists, but it is directed at servers and power plants rather than at the shopper paying more for gasoline, and that is where the history says the margin will give way first.