The most consequential number from the 10-year Treasury auction was not the 5.30% yield. It was the 1.7 basis point stop-through. A tail would have read as a buyers' strike, a temporary dislocation that a policy response could plausibly reverse. A stop-through at 5.30% says something more durable: real money will absorb $39 billion of ten-year paper at that level without a fight. Once the risk-free rate clears cleanly above 5%, it stops being a stress reading and becomes a benchmark. Mortgages, corporate credit, equity discount rates and foreign hedging decisions all price off that benchmark. The secondary market treated the result as relief. For everything downstream of the curve, it was confirmation that the higher hurdle is real.
A Clearing Price, Not a Distress Signal
The auction mechanics support that read. When-issued trading ended at 5.317%, and the auction stopped at 5.30%. That is the biggest stop-through since April of last year. Bids totaled $108.07 billion against $39.00 billion accepted, a bid-to-cover of 2.77. That ratio was up from 2.71 a month earlier and above the six-month average of 2.54. Indirect bidders took 80.3%, or $31.1 billion, against a six-month average of 74%.
Wolf Richter's framing in his WOLF STREET piece is the correct starting point: yield creates demand, and that is its job. At 5.30%, it did that job without strain. The intraday path tells the same story. The 10-year traded as high as 5.36% that morning on fears of an ugly sale. It eased to 5.32% before the auction, in line with when-issued levels, and then slipped to 5.28% afterward.
The progression of the auction yields matters more than any single print. Three months earlier, the 10-year cleared at 4.58%. Two months earlier it took 4.683%, and on September 9 it took 4.834%. This auction took 5.30%. That is 72 basis points in three months, and 47 of them came in the most recent month. Demand did not vanish as yields climbed. It held, and in this auction it improved. A market that keeps clearing while the price keeps falling is not panicking. It is repricing, and repricing tends to stick in a way that panic does not.
Ninety-Four Cents on the Dollar
This sale was the second reopening of the August issue. It carries the same 4.625% coupon, the same CUSIP and the same August 15, 2036 maturity. That structure turns the auction into a clean mark-to-market for anyone who bought the original. On August 12, the notes sold at 99.54 cents on the dollar for a 4.683% yield. This time they sold at 94.86.
The price loss on identical paper is 4.68 points in roughly two months. Two months of coupon carry on a 4.625% note adds back about 0.77 points. The net is a total return of roughly negative 3.9% on a ten-year Treasury held for one quarter of a year. That is the "bloodbath" in concrete terms, and it is spread across every balance sheet holding intermediate duration bought at lower yields.
Richter puts it this way: higher yields appeal to buyers and crush existing holders. The second-order consequence is less visible. Holders who are marked to market (bond funds, insurers with fair-value portfolios, banks carrying securities as available-for-sale) take the loss now, and their marginal capacity to add duration shrinks. That is one reason fresh demand needs a higher yield before it shows up. The mapping of these losses onto specific institutions is inference. No holder-level data is summarized here. The direction of the pressure, though, follows from the arithmetic.
The Curve Is Telling a Fiscal Story
As of October 8, the 10-year stood at 5.22% and the 2-year at 4.75%, putting the 2s10s spread at +0.47 percentage points. The 2-year anchors to expected policy over the next two years. The 10-year carries that expectation plus compensation for holding duration through an uncertain fiscal path. With the front end nearly half a point below the long end, the extra yield is not a forecast of Fed hikes. It is term premium.
Richter makes the fiscal point directly. He argues that 5.30% is still low given current inflation and the deficits Congress and the White House keep producing. In his words, what is shockingly high is the deficit. His broader claim is that the bond market, since 2022, has been emerging from 14 years of rate repression and is now doing its job. He adds that this is what Warsh wants.
That last point is the hinge for the cross-asset read. If the Fed's leadership is content to let the long end find its own level, nobody will cap the term premium. The usual escape valve, the market's expectation that the central bank will step in when long yields get uncomfortable, is weaker. In that setup, auction demand is the only thing standing between supply and yield, and auction demand has just shown its clearing price. Richter's characterization of Fed intent is his reading, not a stated policy commitment. Even so, nothing in the auction result contradicts it.
Where 5.30% Travels Next
This is where the headline misses the story. The bond market absorbed the supply. The repricing it forces lands elsewhere.
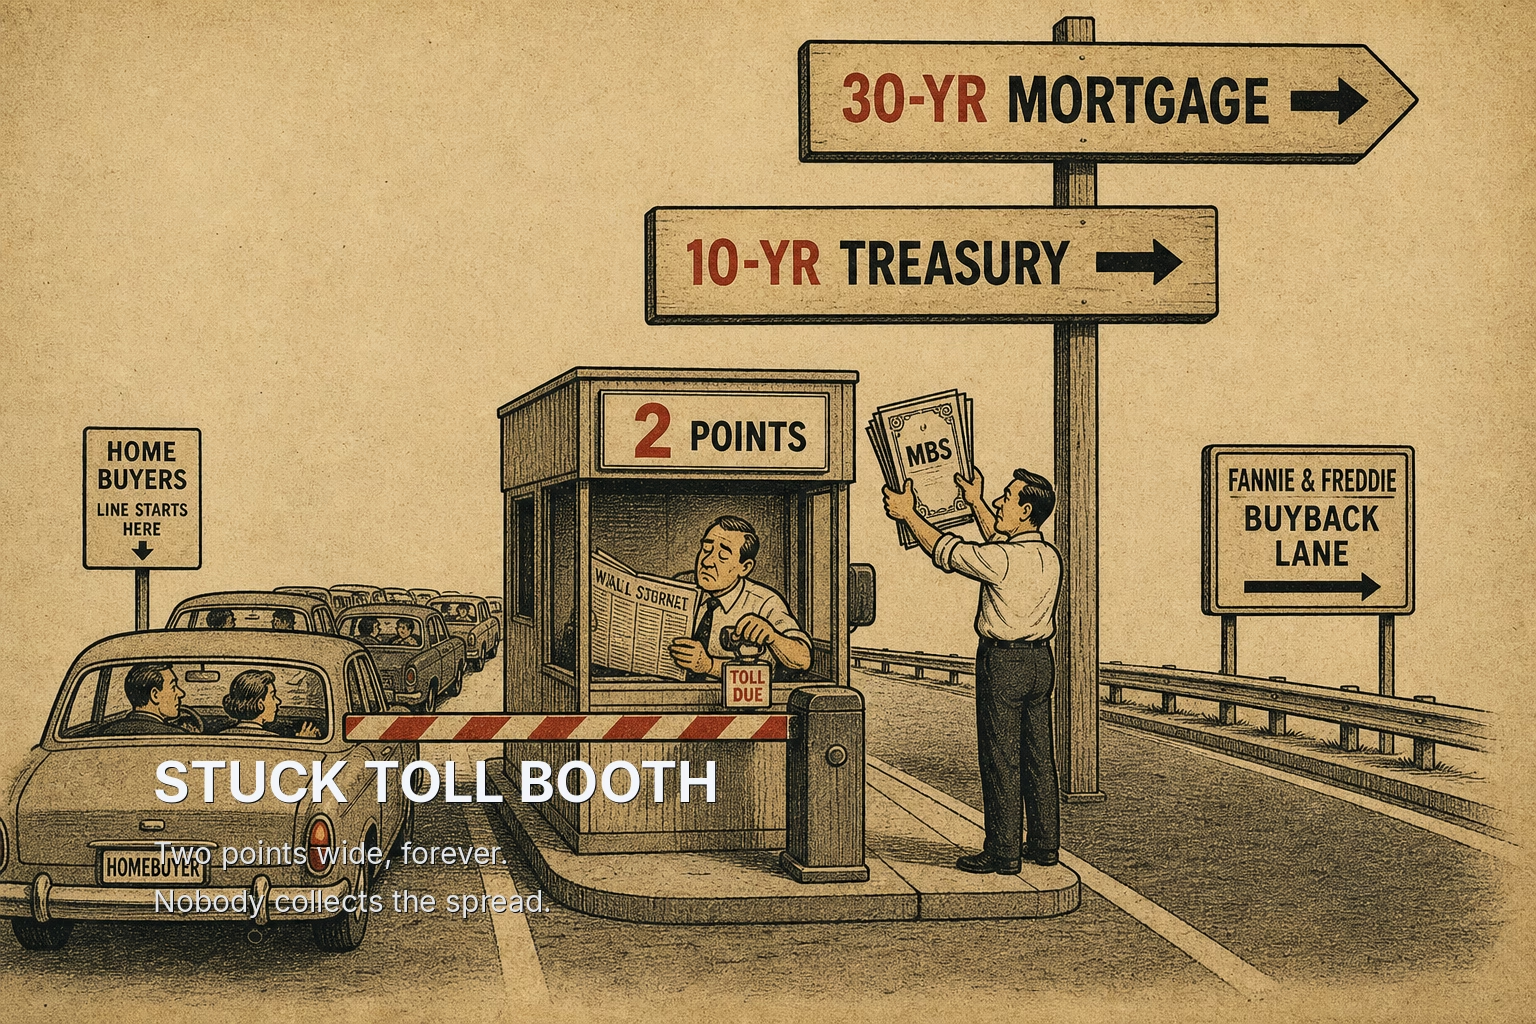
Housing finance. Mortgage rates are priced off the 10-year plus a spread. A clean auction at 5.30% removes the argument that the recent rise was a technical overshoot. A buyer waiting for the "auction scare" to pass and rates to retreat got the opposite signal: the scare passed, and the level held. The 5.28% post-auction print is relief only relative to the 5.36% morning high.
Equity valuation. For any equity index whose earnings yield sits below 5%, the risk-free alternative now pays more than the earnings stream before any growth assumption is made. That is a statement about relative pricing, not a forecast of a selloff. Equities can carry a negative equity risk premium for long stretches if earnings growth delivers. But the hurdle that growth has to clear rose by roughly 70 basis points in a quarter, and this auction says it will not fall back on its own. No index valuation data is summarized here, so the size of the squeeze on any particular market is left open.
Credit. Corporate borrowers refinancing in the coming quarters will price off a Treasury base that is now validated above 5%. Spreads can compress to cushion part of that. All-in coupons, which are what interest-coverage ratios actually respond to, rise with the base.
The dollar and foreign demand. The 80.3% indirect share is the most market-sensitive line in the results. Richter notes that indirect bidders include foreign central banks bidding through the New York Fed, and he reads the high share as substantial foreign interest. That eased fears that overseas investors would walk away from US debt. Two caveats apply. First, the indirect category also includes domestic asset managers bidding through dealers, so the foreign share cannot be isolated from these results. Second, whether foreign demand supports the dollar depends on whether those buyers hedge the currency. Unhedged buying at 5.30% is dollar-supportive. Hedged buying is mostly a rate-differential trade with little net currency effect. The auction shows demand. It does not show which kind, and the FX implication should be held loosely.
The Case That This Was the Top
The strongest counterargument draws on the history Richter cites. The last time a 10-year auction cleared this high was November 2000. Yields were falling then because the dot-com bubble was deflating, and the economy entered recession by March 2001. The four 10-year auctions of 2000 ran from the 6.5% range down to the 5.8% range. High auction yields have sometimes marked the late stage of a cycle, just before growth cracks and duration rallies hard.
On that reading, the stop-through was an early sign of exhaustion among sellers. Buyers who stepped in at 5.30% may be front-running a slowdown that the 2-year at 4.75% is already starting to price. The post-auction drift to 5.28% fits this version too.
The counter has a real weakness. In 2000, yields were falling into the auctions. This time they are rising into them, 72 basis points across four consecutive sales, with the curve steepening rather than inverting. A late-cycle top in yields typically comes with a flattening or inverting curve as the front end prices cuts. A +0.47 spread with the long end leading higher looks more like a supply-and-term-premium problem than a growth scare. Whether the curve resolves by the front end falling (recession) or the long end rising (fiscal) is the question that matters for every asset discussed above.
What Would Change the Read
The thesis is that 5.30% is a validated clearing level, not a stress extreme, and that the burden now falls on assets priced off it. That thesis is wrong if the next 10-year auctions tail meaningfully even as yields stay above 5%, because that would show that demand at this level was a single good day rather than a floor. It is also wrong if the 2s10s spread compresses because the 10-year falls faster than the 2-year. That would be the 2000 pattern, a growth signal overriding the fiscal one.
Three observable conditions decide it. The first is the indirect share at the next 10-year sale: holding above the 74% six-month average keeps the foreign-demand argument intact. The second is the 2s10s spread: widening beyond +0.47 with the 2-year anchored near 4.75% confirms that term premium, not policy, is driving the long end. The third is whether the 10-year can hold below the 5.36% intraday high from auction day. A break above that level after a clean auction would show that even good demand is not enough to absorb the supply, and the repricing outside the bond market would accelerate rather than settle.