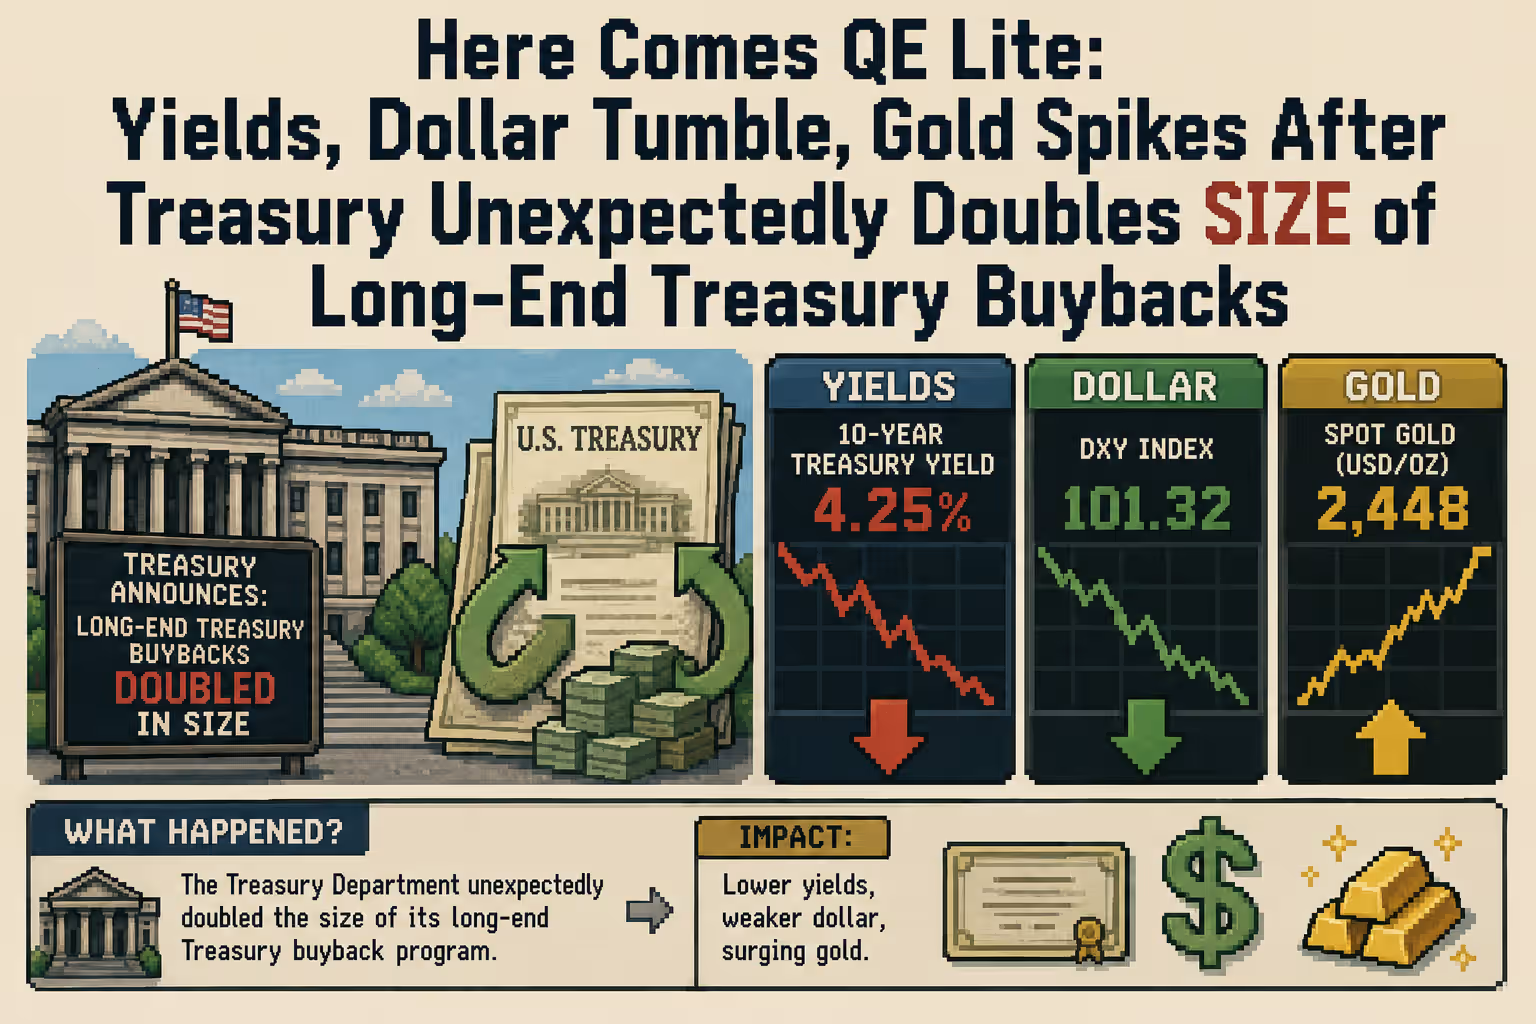
The 37 basis point drop in the 10-year yield from its October 5 closing high is being read as the safe-haven trade winning out over the AI trade. The government's own funding curve tells a different story. This week the Treasury rolled $670 billion of bills into a curve that still slopes upward from 3.91% at four weeks to 4.29% at 52 weeks, with every tenor beyond the shortest pricing above the 3.88% effective fed funds rate. The equity selloff pushed investors into duration. It did not lower the rate at which Washington actually refinances. For a borrower with $7.12 trillion of paper that turns over in under a year, the second fact matters more.
The Funding Curve Never Joined the Rally
Seven bill auctions and four note auctions cleared this week, $907 billion in total. Headline commentary centers on the notes because their yields moved. The 2-year auctioned at 4.708%, 8 basis points below last month, and the 5-year and 7-year also cleared lower than a month earlier. By Friday the 10-year sat at 4.94% and the 2-year at 4.56%, leaving the 2s10s spread at +38 basis points as of October 30.
The bill stack carries the credit signal. Bill yields eased, but their shape stayed the same. The 13-week cleared at a high rate of 4.05%, about 17 basis points over the effective fed funds rate. The 26-week cleared at 4.21%. In the secondary market the 6-month yield ended the week at 4.275%, 37 basis points over fed funds. In plain terms, the market still expects at least one hike within six months, even after the risk-off week.
So the Treasury is refunding its largest single liability category at rates that already price tightening. A cheaper 10-year does nothing for that refinancing bill. Most of this week's $670 billion replaced maturing bills, and those maturing bills were issued earlier at rates closer to today's policy rate, or below it.
Seven Bill Auctions, One Repricing Machine
The arithmetic is simple. Bills outstanding rose from $2.5 trillion at the start of 2020 to $7.12 trillion at the end of September. Since January 2025 the stock has grown by $930 billion. Bills have held at roughly 22% of marketable debt since early 2024, after climbing from 16% in early 2023 under Yellen. Bessent has kept that share where he inherited it. The heralded shift toward bills has not happened.
A 22% share does not need to rise to be dangerous. It is already enough to make rate hikes reach the deficit within months. At $7.12 trillion, each 25 basis point increase in bill rates adds about $17.8 billion a year to interest expense once the stock rolls. That full effect arrives within twelve months, because no bill outlives one. The 2-year floating rate note has the same feature built in: it resets weekly off the latest 13-week auction plus a 0.038% discount margin, so this week it pays 4.088%.
That discount margin is a quiet tell. Buyers accepted less than 4 basis points of spread to hold two-year floating exposure to the US government. That is a narrow premium for two years of reinvestment convenience, and it shows real demand for paper that floats with policy rather than locking in a fixed coupon. Investors who expected the Fed to cut would want fixed coupons. Investors who expect hikes, or no longer trust forward guidance now that Warsh has abandoned it, want resets. The FRN auction is a small trade at $33 billion, but it points the same direction as the bill curve.
The credit-analyst framing is that the Treasury now faces its own refi wall, and it is a weekly one. A corporate borrower with 22% of its debt maturing inside a year, refinancing into a curve that prices higher policy rates, would be flagged for funding risk no matter how strong its long-dated bonds looked. The 10-year rally improves the price of the government's term debt. It does not reduce the near-term rollover burden.
What the Two-Year Did That the Ten-Year Did Not
The composition of the rally argues against a pure flight-to-safety reading. The 2-year fell 14 basis points from its Monday auction level to its Friday close. The 10-year fell 6 basis points over the week. The policy-sensitive end did most of the work, and the curve bull-steepened.
That pattern tells us more than the safe-haven label does. Classic flight-to-quality buying hits the long end, because long duration is what protects an equity portfolio. A front-led move means the market is revising its Fed path. The most coherent explanation is that falling AI and chip stocks tightened financial conditions, and traders concluded the equity selloff would do some of the Fed's work. That is a credit channel, running through wealth effects and capital-raising conditions, and not just a preference for safety.
The revision only went so far. Even after the drop, the 2-year sits 68 basis points over fed funds. Bond buyers cut back their hike expectations. They did not remove them. That is why the bill curve barely changed shape while note yields fell: bills price the next two or three policy meetings, and those still look hawkish.
The Corporate Duration Competing for the Same Buyers
The less obvious exposure lies at the intersection of Treasury supply and corporate credit. Richter notes that the government must place about $2.2 trillion a year of new debt, and that it competes with corporate issuance offering much higher yields, especially from the AI sector. An AI equity selloff hits that competition from two directions.
In the near term, it helps Treasuries. Money leaving AI equities, and potentially AI-linked credit, looks for duration, and Treasuries are the deepest pool. That is part of why the 7-year cleared at 4.894% and the 5-year at 4.845%, both below last month.
Over a longer horizon, the effect could reverse. If the AI capital cycle depends on debt financing, a weaker equity cushion under those borrowers should make lenders charge more. Wider spreads on AI-linked corporate debt would pull yield-seeking capital toward that paper and away from Treasuries at the margin. This link is an inference, not an observation. No credit spread data is cited here, and the argument depends on AI-sector spreads widening, which has not been confirmed. What is supported is the setup: the Treasury's financing need does not shrink when equities fall, and its competitors for duration buyers may soon pay more to borrow.
The Case That This Is Simply a Bond Rally
The strongest counterargument deserves a fair statement. The 10-year rose 131 basis points, from 4.0% to 5.31%, in less than eight months. Pullbacks after surges like that are common, and the auctions were well absorbed: every note tenor cleared at a lower yield than a month ago. Strong auction demand at lower yields is the opposite of a funding strain. On this view, the bill curve's upward slope is just ordinary pricing of a hiking cycle the market already understands, and the Treasury's 22% bill share has held steady for nearly two years without causing trouble.
Part of this is right. Demand is not the issue. The $907 billion cleared. The weak point is cost and speed. A stable bill share applied to a growing debt stock means the dollar amount exposed to repricing keeps rising, and this week's demand came at rates above the current policy rate. The counterargument also has a timing problem. If yields keep falling because hikes get fully priced out, bill rates follow and the funding concern fades. If yields are only taking a technical pause, as Richter argues and as his decision to stop buying at the 10-year auction implies, then the Treasury rolls hundreds of billions each week into a curve that could reset higher.
Richter's fundamental case for higher long yields rests on three factors: inflation that will not settle, heavy new supply, and corporate competition for capital. All three also apply to bills. The bill market will feel them first, because it reprices first.
The Spread That Settles It
The deciding indicator is the gap between the 6-month bill and the effective fed funds rate, now 37 basis points. It has a decent record of predicting policy moves several months in advance, and it has peaked this cycle, with the 6-month trading as high as 4.41% on September 28. If the AI selloff is tightening conditions enough to replace Fed hikes, that spread should narrow toward zero over the coming weeks, and the 13-week high rate should fall back toward 3.88%. If it does, the safe-haven reading holds and the Treasury's rollover costs ease with it.
If the spread holds above 30 basis points while the 10-year stays below 5%, the market will be showing a split: cheaper term debt alongside expensive short-term funding, with 22% of the government's marketable debt tied to the expensive side. That would confirm the credit read. The rally lowered the price of duration, and the Treasury still mostly borrows short.