The single most consequential number in this research is not r-star itself. It is the ±225 basis point confidence band that surrounds investors' estimat...
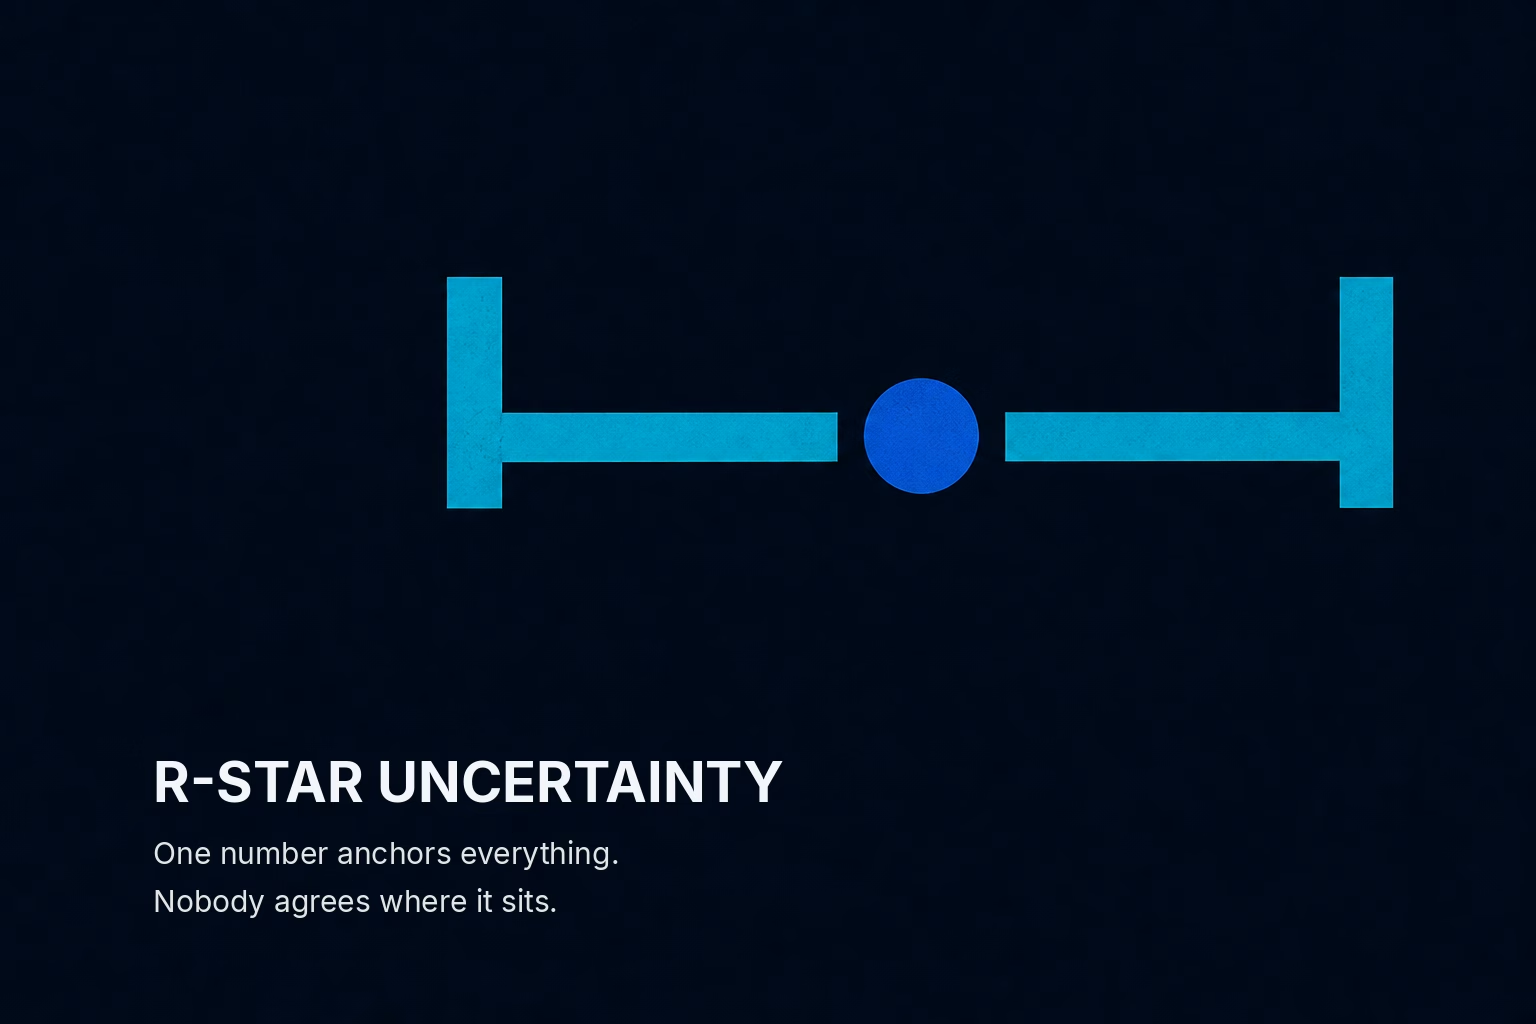
The single most consequential number in this research is not r-star itself. It is the ±225 basis point confidence band that surrounds investors' estimate of the nominal interest rate trend. That range is roughly the size of a full Fed hiking cycle. When the object that anchors the entire term structure carries error bars that wide, the practical implication is direct: much of what desks read as a signal about future policy in the shape of the curve is actually noise about where the anchor sits. The market does not have a clean opinion about r-star. It has a wide, slow-moving cloud of belief, and that cloud is the thing being priced.
What the Yield Curve Can and Cannot Say
Policymakers treat the term structure as a window into private beliefs about future policy, inflation, and growth. The Roussellet framework sharpens what that window actually shows. Investors observe three things directly: the short rate, inflation, and growth. What they cannot observe, in real time, is the decomposition of each into a durable trend and a transient cycle. A 5 percent policy rate could be 2 percent trend and 3 percent cycle, or some other split. Investors infer the division optimally given their information, but the inference is imperfect and, crucially, subjective.
The consequence reorders a common assumption. Bond yields do not encode the true trend and cycle. They encode the perceived ones. Policymakers can still learn from the curve, but only to the extent that investors hold information the policymakers lack. The curve reveals what investors can see and nothing more. It is a mirror of private belief, not a readout of the underlying economy. Any inference a central bank draws from long yields inherits whatever misperception is embedded in the market's own trend-cycle split.
The Confidence Band Is the Finding
The empirical results, estimated on quarterly U.S. yield-curve and macro data going back to the 1960s, produce trends that behave sensibly. The perceived nominal rate trend, inflation trend, and growth trend all move slowly, as trends should. The surprise is the width of the uncertainty around them.
The 95 percent confidence band on the nominal interest rate trend, i-star, comes in at roughly ±225 basis points. For the inflation trend, pi-star, it is about ±125 basis points. For the growth trend, roughly ±80 basis points. At the end of the sample in 2022, i-star is estimated at 3.75 percent, with a 95 percent band running from 1.55 percent to 5.95 percent. Because the finance-based r-star in this framework is the spread between the nominal rate trend and the inflation trend, the uncertainty in r-star inherits the uncertainty in both. Two wide bands subtracted from each other do not produce a narrow one.
This is where the framing matters for anyone reading policy off the curve. A move in long yields that a desk attributes to a shifting view of neutral could just as easily be the market relocating its estimate inside a band that was always this wide. The trend did not necessarily change. The perception of where the trend sits inside its own error range did. Those are different events with different trading implications, and the standard reading of the curve does not distinguish them.
Why This Reads as a Slow-Moving Policy Catalyst
The regulatory and policy read here is not about a filing or a rule. It is about how a research finding of this kind gets absorbed by the institutions that price and set rates, and the honest answer is slowly. Staff research does not move markets on publication. It moves the framework that policymakers and, eventually, sophisticated desks use to interpret the same data everyone already has. The catalyst is not the paper. It is the gradual re-weighting of how much confidence anyone should place in a point estimate of neutral.
Who is forced to act, and on what timeline? The Fed's own communication is the first pressure point. When the committee publishes a longer-run rate projection, it is publishing a point on a distribution this research argues is far wider than the dot suggests. That does not force a change tomorrow. It does raise the standard for how much weight the market should give any single neutral-rate signal, whether it comes from a dot plot or from the curve itself. The second pressure point sits with fixed-income desks that build fair-value models anchored to an estimated neutral rate. A framework that says the anchor is known only to within a couple hundred basis points argues for wider fair-value ranges and less conviction in mean-reversion trades keyed to a precise r-star.
The timeline is measured in quarters and cycles, not days. That is exactly why the read is underpriced. A slow-moving reframing of a core input rarely gets marked on the day it appears. It shows up later, in how disagreement about neutral persists longer than expected, and in how curve moves that look like fresh information turn out to be repricing inside an old, wide band.
The Case Against Overreading This
The strongest counterargument is that confidence bands estimated from a model are model artifacts, not market truths. A different specification of trend and cycle, a different treatment of the private-information factor, or a different sample could narrow those bands considerably. The ±225 basis point figure is a property of this framework applied to this data, and no framework of this kind is the last word on how investors decompose the economy. A reader who treats the specific band width as a hard fact about the market is overreaching.
There is a second limitation worth stating plainly. The framework infers investor uncertainty rather than measuring it directly. Investors do not report their subjective trend-cycle split; the model backs it out from prices and macro data under assumptions about how they process information. The estimated uncertainty is therefore conditional on those assumptions being a reasonable description of behavior. If real investors anchor more tightly to survey-based or official neutral-rate estimates than the model allows, the true uncertainty could be smaller than the bands imply.
Neither objection overturns the direction of the finding. Even if the precise width is contestable, the qualitative claim survives: the trend-cycle decomposition is unobservable in real time, r-star is a difference of two uncertain trends, and the curve reflects perceived rather than true components. The magnitude is arguable. The structure is not.
What Would Change the Reading
The view here holds as long as neutral-rate uncertainty stays wide and slow to resolve. The observable condition that would break it is a persistent narrowing of disagreement about neutral, visible in tighter dispersion across professional forecasts of the long-run rate and in curve behavior that stops treating neutral as a moving, uncertain target. If forecasters converge and stay converged through a full cycle, the practical case for wide fair-value bands weakens, and reading a precise r-star off the curve becomes more defensible.
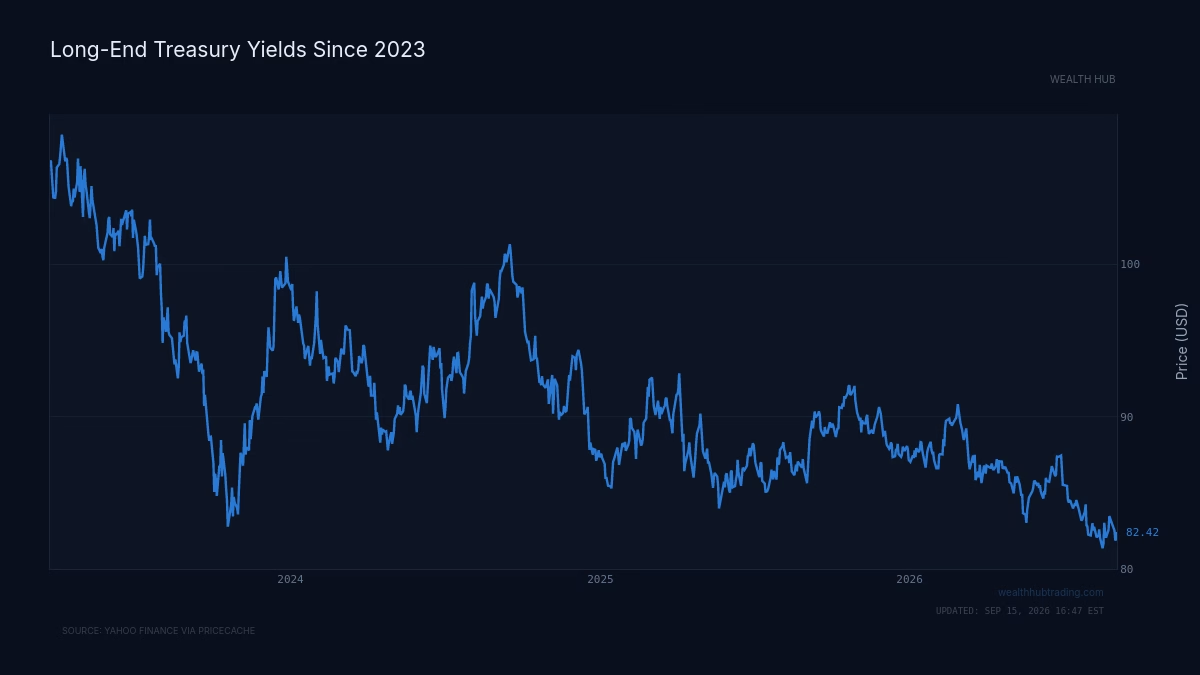
Until that convergence appears, the cleaner reading is that the term structure carries less precise information about neutral than its daily movements imply. The instrument to watch is the long end of the U.S. curve, where any shift in perceived neutral would register first.