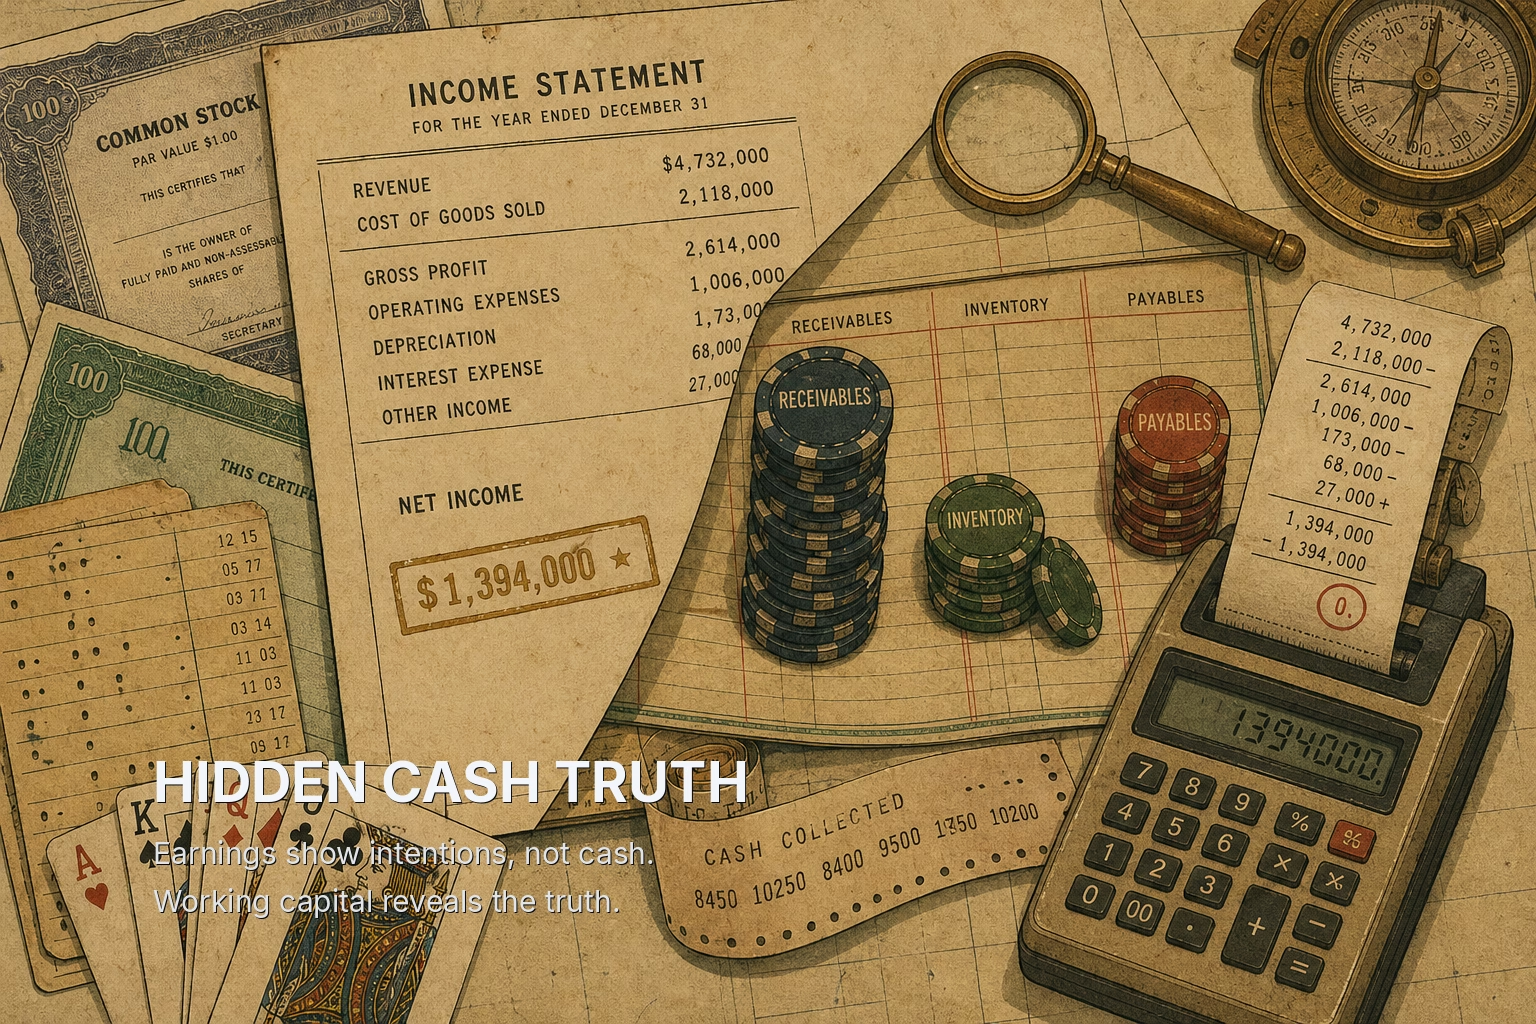
Earnings can be manufactured for several quarters. Cash cannot. The difference between the two lives in three balance-sheet lines that most readers skip on the way to the earnings-per-share figure: receivables, inventory and payables. When a business starts to turn, those lines often move first, and the profit line catches up later, sometimes two quarters later and sometimes in a restatement.
Record earnings, negative cash: Sunbeam in 1997
Sunbeam under Al Dunlap is the cleanest illustration of the gap. For 1997 the appliance maker reported net income of roughly $109 million, a dramatic turnaround that the market rewarded. Operating cash flow for the same year was negative. The company had booked record profits and consumed cash doing it.
The explanation sat in working capital. Sunbeam had pushed product onto retailers through "bill-and-hold" arrangements, recording sales on goods that customers had agreed to buy but had not taken delivery of, and through generous terms that pulled future orders into the current period. Revenue rose. Receivables rose faster. Inventory, much of it sitting in Sunbeam's own warehouses on behalf of customers who did not need it yet, swelled alongside.
None of this was hidden. The balance sheet and cash flow statement disclosed it. In 1998 the pulled-forward demand left a hole in subsequent quarters, the board removed Dunlap, and the 1997 results were restated. The P&L eventually admitted what the working-capital lines had been saying for a year.
The lesson is not that every receivables build is fraud. It is that the filings showed the problem in plain numbers while the headline narrative described a turnaround.
Why the balance sheet tells the story first
Why does this matter? Because accrual accounting lets revenue and cost recognition run ahead of cash, and working capital is the account that absorbs the difference.
Working capital here means operating working capital: receivables plus inventory minus payables. Receivables are sales recognized but not yet collected. Inventory is cost spent on goods not yet sold. Payables are bills received but not yet paid. A rise in receivables or inventory consumes cash; a rise in payables supplies it.
The causal chain runs in a predictable order. First, demand softens at the end customer. Second, the company's sales force, still carrying quotas set during better times, extends terms or ships ahead of orders to hit the number, and receivables grow faster than revenue. Third, production plans built on the old forecast keep running, so inventory accumulates. Fourth, to fund both, the company slows payments to suppliers, and payables stretch. Only after those levers are exhausted does revenue growth slow, discounting begin, and gross margin fall.
Each of those stages is visible in a quarterly filing before the final one hits the income statement. What this means for you: read the balance sheet in the 10-Q before you read the earnings release, because the release is written to emphasize the last stage and the balance sheet records the first three.
Reading the three accounts with one worked example
Three ratios convert the raw balances into days, which makes them comparable across quarters and companies.
Days Sales Outstanding (DSO) = Receivables / Revenue × days in period
Days Inventory Outstanding (DIO) = Inventory / Cost of Goods Sold × days in period
Days Payables Outstanding (DPO) = Payables / Cost of Goods Sold × days in period
Cash Conversion Cycle = DSO + DIO − DPO
Take a hypothetical industrial company over two quarters of 91 days each.
In Quarter 1, revenue is $500 million, cost of goods sold is $300 million, receivables are $275 million, inventory is $200 million and payables are $150 million.
DSO = 275 / 500 × 91 = 50 days. DIO = 200 / 300 × 91 = 61 days. DPO = 150 / 300 × 91 = 46 days. Cash conversion cycle = 50 + 61 − 46 = 65 days.
In Quarter 2, revenue grows 4% to $520 million and cost of goods sold to $312 million. The press release celebrates growth. But receivables climb to $343 million, inventory to $257 million and payables to $199 million.
DSO = 343 / 520 × 91 = 60 days. DIO = 257 / 312 × 91 = 75 days. DPO = 199 / 312 × 91 = 58 days. Cash conversion cycle = 60 + 75 − 58 = 77 days.
Revenue rose 4%. Receivables rose 25% and inventory 29%. The company now waits 12 more days to turn a dollar of cost into a dollar of cash, and it masked part of the deterioration by paying suppliers 12 days later. Working capital, net of payables, rose from $325 million to $401 million: a $76 million cash drain against a quarter that reported higher sales.
The practical takeaway is to compare the growth rate of each balance with the growth rate of the line it relates to. Receivables growing materially faster than revenue, or inventory faster than cost of sales, is the specific disclosure to flag.
The economic incentives that produce the gap
The pattern is not a statistical accident. It comes from the incentives of specific people inside and around the company.
Sales teams are paid on recognized revenue, not collected cash. When end demand slows, the cheapest way to protect a quarter is to offer a distributor 90-day terms instead of 30, or a volume rebate that loads its warehouse. The sale is recorded; the receivable carries the cost. Distributors accept because the terms amount to free financing, and they will simply order less next quarter.
Operations teams are measured on utilization and unit cost. Cutting production raises per-unit overhead and shows up as a margin hit immediately, so plants keep running on the old forecast. Inventory becomes the buffer that preserves reported margin today at the price of a markdown later.
Treasury teams, watching the cash drain from the first two moves, lean on suppliers. Stretching payables from 45 days to 60 is an interest-free loan from the supply chain. It also has a ceiling: suppliers eventually demand payment, tighten terms or raise prices, and the borrowed cash has to be returned.
Suppliers and customers are effectively lenders in this system, and their tolerance is finite. That is why the reversal, when it arrives, often arrives quickly: the customer stops reordering, the inventory needs discounting, and the supplier calls in its credit in the same quarter. What this means for you: a stretched DPO is not a sign of bargaining power when it coincides with rising DSO and DIO. In that combination it is a funding source being drawn down.
Nike's inventory and the same tell in a modern filing
The mechanism is not confined to the 1990s. In the quarter ending August 2022, Nike reported inventories of $9.7 billion, up 44% from a year earlier, while revenue grew at a far slower pace. Gross margin fell about 2.2 percentage points in that quarter as the company moved to clear excess product, and the stock dropped sharply on the release. The inventory had already been climbing in the prior quarter's filing.
Nike's case differs from Sunbeam's in an instructive way. Part of the build reflected supply-chain disruption: goods ordered long in advance arrived late and all at once. The cause was operational, not manipulative. The financial consequence was the same. Cash tied up in unsold goods eventually had to be released through discounts, and the margin line absorbed the cost after the balance sheet had already shown the problem.
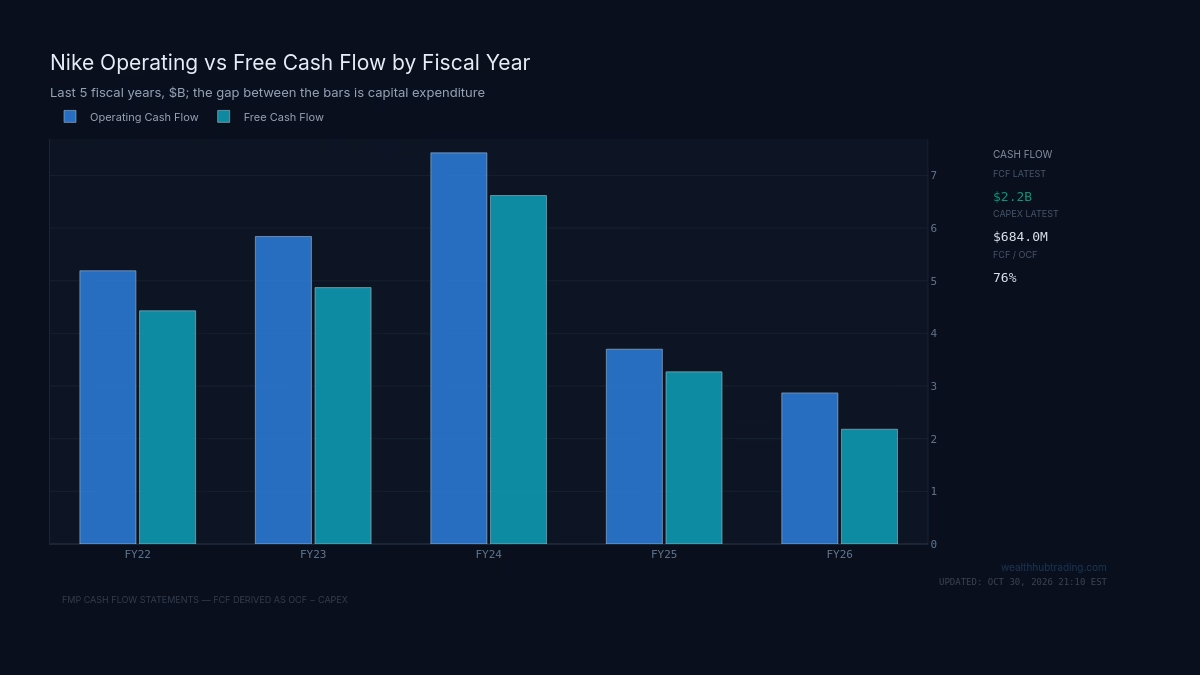
The release of that inventory is also visible. As the excess cleared, cash came back out of working capital, and operating cash flow could improve even when revenue was roughly flat. The chart below shows Nike's operating and free cash flow across recent fiscal years. The movement in operating cash flow tracks the build and unwind of inventory more closely than it tracks sales growth.
When a working-capital build is not a warning
The signal fails in identifiable situations, and misreading them produces false alarms.
Seasonality. A toy maker's inventory peaks before the holidays and its receivables peak just after. Comparing a September balance with a June balance will always look alarming. Compare each quarter with the same quarter a year earlier.
Acquisitions. Buying a company adds its receivables and inventory to the balance sheet immediately, while only a partial quarter of its revenue appears. DSO and DIO spike mechanically. Check the acquisition footnote before drawing conclusions.
Deliberate pre-builds. A semiconductor company stocking up ahead of a confirmed product launch, or a retailer buying ahead of a tariff, is building inventory against known demand. The test is whether the build is explained in the filing with a timeline, and whether the following quarter's sales absorb it.
Mix shifts in customers. Winning a large customer on longer standard terms raises DSO permanently without signalling distress. The receivables are collectible, simply slower.
Hidden payables. Supply-chain finance programs, where a bank pays suppliers early and the company repays the bank later, can keep reported payables looking normal or reclassify the obligation. When disclosed, these programs appear in the notes. A DPO that looks stable while the company relies on such a program is less reassuring than it appears.
Each of these is a reason to investigate rather than a reason to dismiss. The common thread is that a legitimate build has an explanation in the filing and a resolution in the next quarter's revenue. A troubling build has neither.
What to do with the next 10-Q
The guided narrative will describe demand, pipeline and confidence. The balance sheet records what customers actually paid for and what the company actually sold. When the two disagree, the balance sheet has often been right first.
Start with the cash flow statement's working-capital adjustments, then compute DSO, DIO and DPO against the same quarter a year earlier. Flag any quarter where receivables or inventory grow substantially faster than their related income-statement line, and treat a simultaneous stretch in payables as confirmation rather than offset. Then read the notes for acquisitions, pre-builds and supplier finance programs before concluding.
The mechanism in one sentence: when reported profit outruns cash, the shortfall accumulates in receivables and inventory, financed by suppliers, until customers stop absorbing it and the margin line pays the bill. The quarter that admits it is rarely the quarter that revealed it.