On March 9, 2020, the Federal Reserve was days from cutting rates to zero, the US was becoming the epicenter of a pandemic, and the dollar index sat near 94.6. Eleven days later it traded close to 103. That is a gain of roughly 8.7% for the world's most liquid currency, earned while every textbook input (falling US rates, a collapsing US economy, emergency monetary easing) pointed down. The rally did not reflect anyone's view of America. It came from a balance sheet problem that played out across the rest of the world, in markets far from the currency desk.
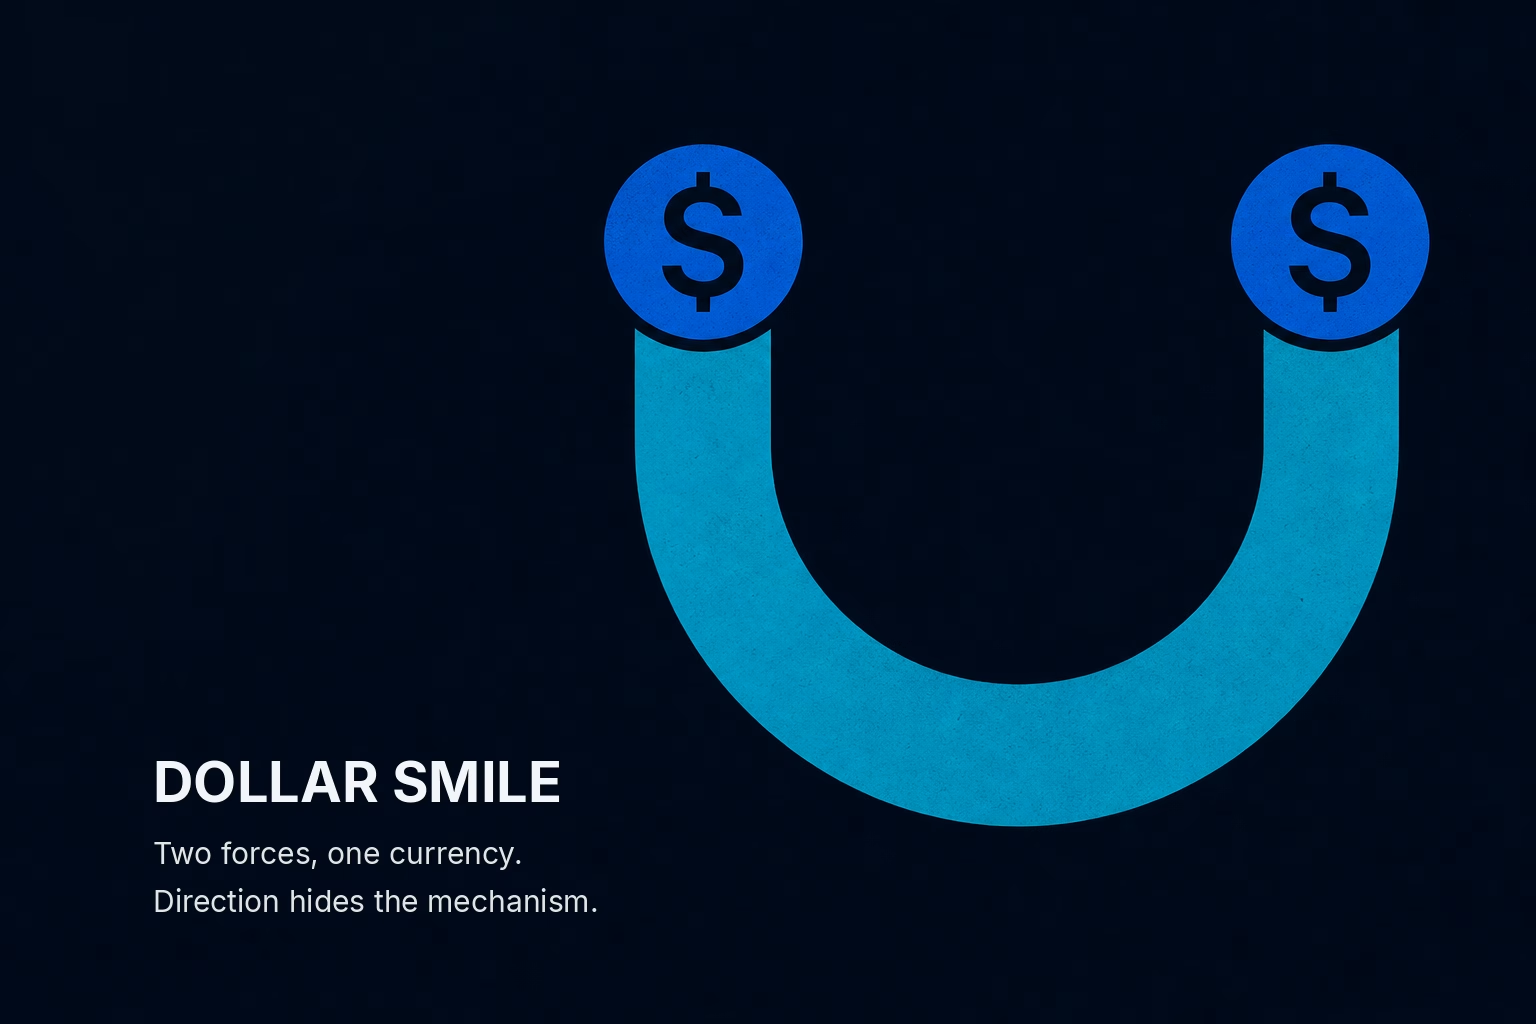
That episode is the cleanest way into the dollar smile, a framework associated with Stephen Jen, then at Morgan Stanley, in the early 2000s. Picture a U-shaped curve. On the left end, the dollar rises because the world is panicking. On the right end, it rises because the US is outgrowing everyone else. In the flat middle, where global growth is broad and calm, it drifts lower. Commentary on the dollar usually tracks the Fed narrative. A sharper reading follows what a dollar move forces elsewhere, because the left side of the smile is driven by forced buying, and forced buyers do not care about rate differentials.
What actually happened in March 2020
The dollar index measures the dollar against a basket of six major currencies, with the euro the heaviest weight. In the first half of March 2020, the US 10-year yield fell toward record lows and the Fed delivered 150 basis points of cuts across two emergency meetings. A basis point is one hundredth of a percentage point, so 150 basis points is 1.5%. On a pure rate-differential model, the dollar should have weakened sharply, because holding dollars suddenly paid much less.
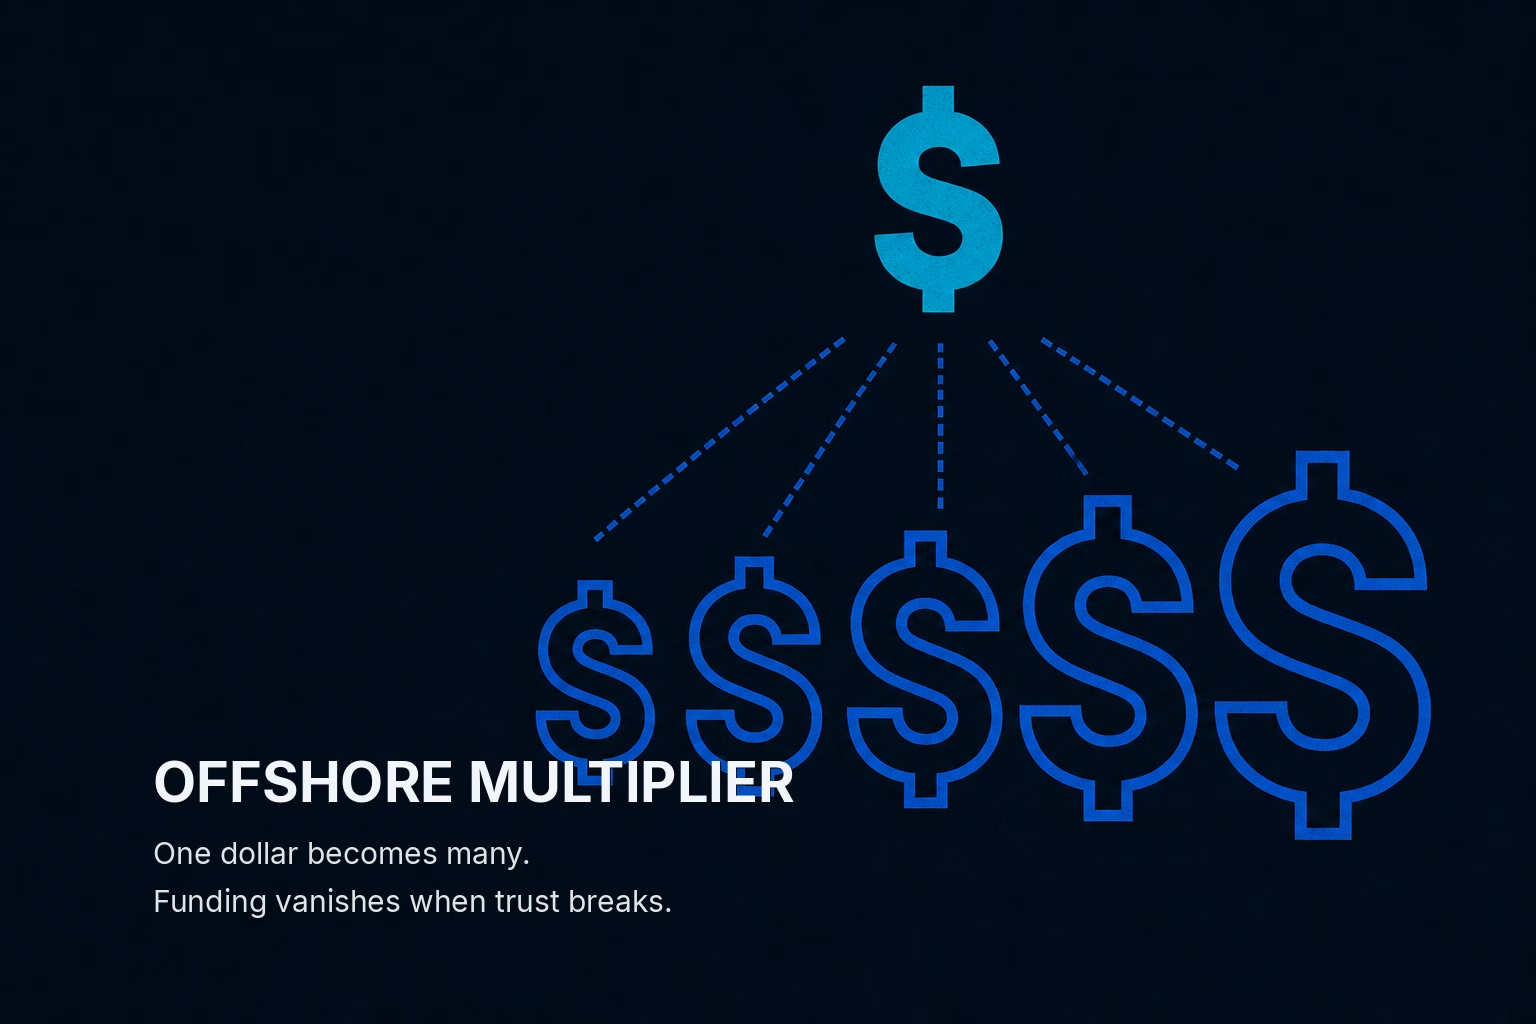
It went the other way because of who owed dollars. Banks, corporations, and governments outside the US had borrowed trillions of dollars in dollar-denominated debt, from Asian exporters funding receivables to European banks financing dollar assets. Insurers and pension funds in Japan and Europe also held large US bond portfolios hedged back into their home currency through rolling short-term contracts. When asset prices fell and revenues stopped, every one of those participants needed dollars at the same moment, either to service debt, meet margin calls, or roll hedges.
The measurable symptom was the cross-currency basis, the extra cost a non-US borrower pays to swap home currency into dollars beyond what interest rates alone imply. It blew out across yen and euro pairs. The dollar peaked around March 19 and 20, which is the same week the Fed extended dollar swap lines to nine additional central banks. Swap lines let foreign central banks borrow dollars from the Fed and lend them on to their own banks. Once the Fed became the dollar lender of last resort to the world, the forced buying stopped and the dollar rolled over.
The lesson for you: the left side of the smile ends when dollar supply arrives, not when sentiment improves. Swap-line announcements and Fed liquidity facilities mark that turning point more reliably than equity bottoms do.
Why the left side is a funding mechanism, not a haven preference
Calling the left side "safe-haven demand" sounds like a choice, as if investors decide they would rather hold dollars. The mechanism is closer to a margin call. The dollar is the world's dominant funding currency, which means a large share of global leverage is borrowed in dollars by entities whose income arrives in something else. That mismatch is harmless while credit is flowing, because maturing dollar debt can simply be rolled.
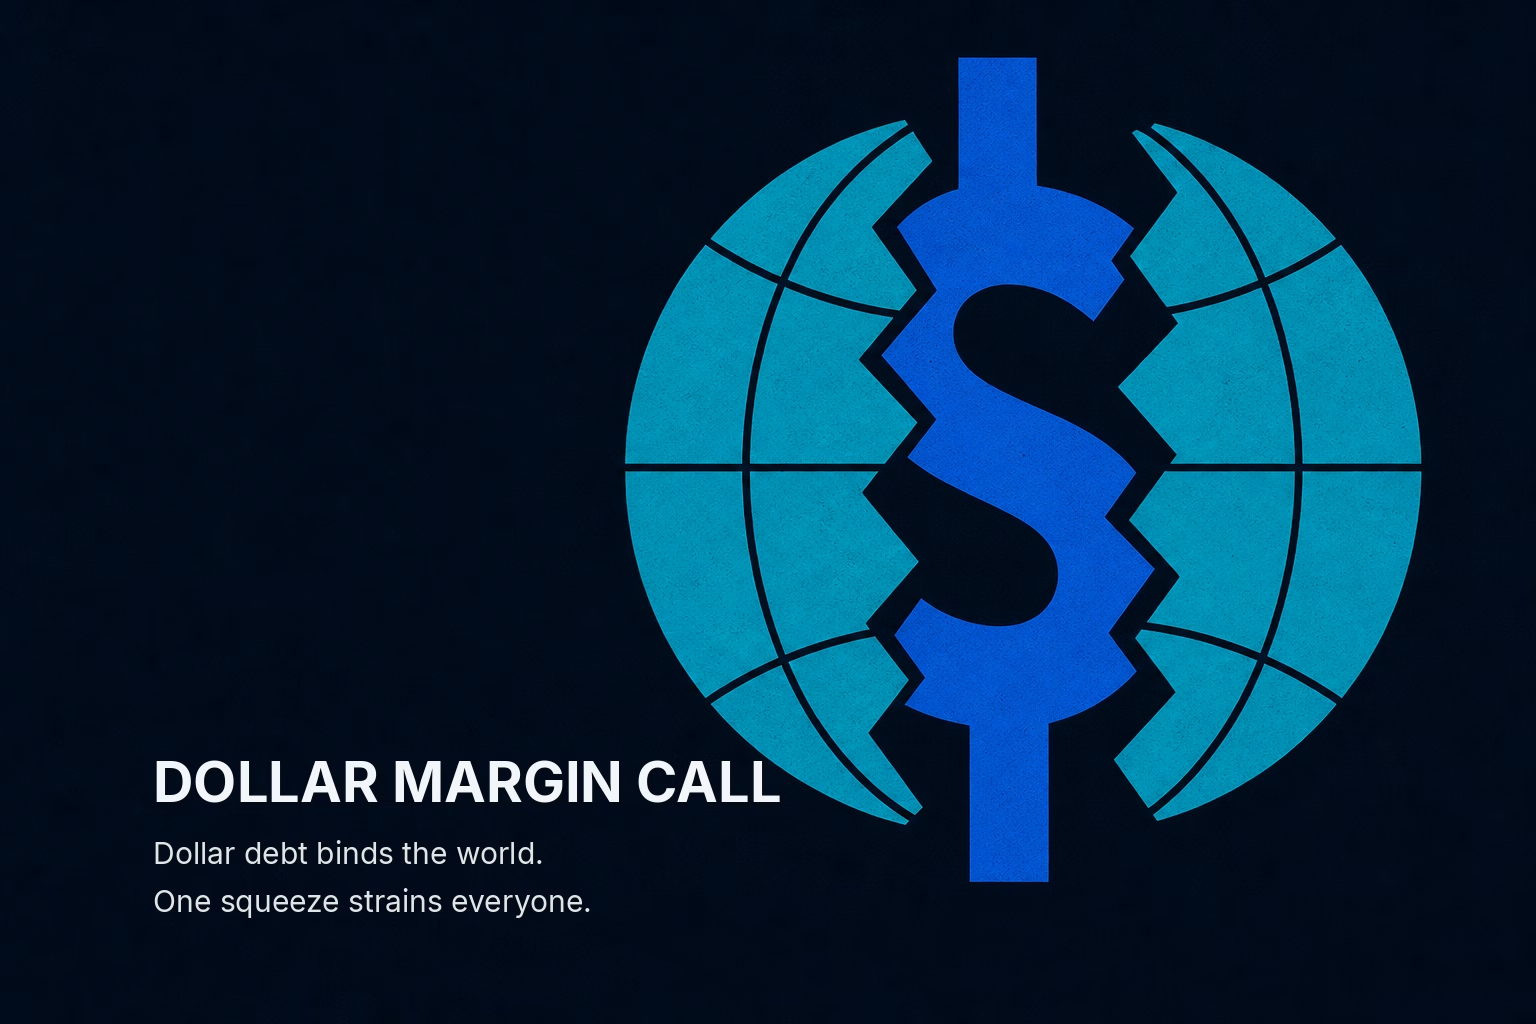
In a shock, three actors become forced buyers at once. Foreign borrowers face dollar repayments with shrinking local-currency revenue, so they sell local assets and buy dollars. Hedged foreign investors holding US assets see the value of those assets fall, which leaves them over-hedged, and closing the excess hedge requires buying dollars back. Emerging-market central banks defending their currencies sell dollar reserves, but they often sell US Treasuries to raise them, which pushes the forced flow into the most liquid market in the world. Each of those flows bids the dollar regardless of where US rates are heading.
This is why the left-side rally is violent and short. The 2008 crisis shows the same shape on a larger scale: the dollar index climbed from about 71 in spring 2008 to near 88 by November, a gain of roughly 23%, even though the crisis originated in American mortgage markets. The source of the panic did not matter. The location of the debt did.
The practical consequence is a cross-asset one. When the dollar rips on the left side, it tightens financial conditions for every dollar borrower simultaneously, which pushes emerging-market spreads wider and commodities lower in a self-reinforcing loop. A rising dollar in a selloff is a cause of further stress as much as a symptom of it.
The right side runs on returns, not fear
The right end of the smile has entirely different plumbing. Here the dollar rises because US growth, US earnings, and US yields outrun the rest of the world, so capital flows toward the higher return. The clearest recent example is 2022. The Fed hiked aggressively against an inflation surge, US yields rose faster than European and Japanese yields, and the dollar index reached about 114.8 in late September 2022, its highest level in two decades.
On the right side, rates and the dollar move together. Higher US yields raise the reward for holding dollar assets, and stronger US growth raises expected equity returns, so foreign investors buy and domestic investors stay home. This is the textbook rate-differential channel working as designed.
The second-order effects rhyme with the left side but arrive more slowly. A rising dollar exports tightening: it raises the local-currency cost of dollar debt service, forces other central banks to hike or burn reserves to defend their currencies, and lowers dollar-denominated commodity prices. Japan intervened to support the yen in the autumn of 2022 for exactly this reason. You cannot fight a right-side dollar with a cheaper valuation argument, because the flow is chasing return, and the return is real.
The practical takeaway: on the right side, the dollar's direction keys off the US rate path relative to other central banks, so the relevant input is the spread between US and foreign yields, not the absolute level of US yields.
The boring middle, and why it is the only place shorts get paid
Between the two tails sits a world of synchronized growth, low volatility, and an absence of forced dollar demand. Capital leaves the US in search of higher-beta returns in Europe, Asia, and emerging markets, and the dollar drifts down. In 2017, a year of broad global expansion and steady markets, the dollar index fell close to 10%.
This middle zone is where a dollar short earns its keep, and it explains the signal in the title: dollar shorts die at both extremes. A worked example shows how.
Suppose you short $10 million of dollars against a foreign currency whose short-term rate is 2.0%, a hypothetical figure chosen for illustration. With the US 2-year yield at 4.79%, the position pays roughly the rate gap as negative carry, the ongoing cost of holding a position that borrows the higher-yielding currency:
Annual carry cost = Notional × (US rate − foreign rate)
$10,000,000 × (4.79% − 2.0%) = $279,000 per year, or about $23,250 a month.
That bleed is what kills the short on the right side: the dollar does not even need to rise, it only needs to fail to fall fast enough. Now apply a left-side shock of the March 2020 size. An 8.7% dollar rally on $10 million is a loss of about $870,000 in under two weeks, more than three years of carry. A short that survives the right side by being patient is destroyed on the left side by being leveraged.
The implication is uncomfortable but concrete. Being short the dollar requires confidence that you are in the middle and will stay there, which means betting against both a US growth surge and a global accident at the same time.
Where the smile breaks
The framework is a description of two separate mechanisms, and either can fail. The left side assumes the dollar is the funding currency and the US is the safe harbor. When the shock originates in US policy credibility itself, that assumption can crack. In April 2025, after the tariff announcements, US yields rose while the dollar fell, a combination the smile does not predict: rising yields alongside a weakening currency suggests investors were demanding more to hold US assets, not rushing toward them. The UK in September 2022 is a cleaner precedent for the pattern, where gilt yields and sterling diverged because the market was questioning the fiscal backdrop.
The right side breaks in a subtler way. Higher US yields support the dollar only when they reflect growth or a hawkish Fed. When long-end yields climb because investors want compensation for fiscal risk or inflation uncertainty, the yield rise can coincide with capital leaving rather than arriving. The signature is the same divergence: yields up, dollar down.
The left side can also be short-circuited by policy. Permanent Fed swap lines and the standing repo facility for foreign central banks exist precisely to cap the funding squeeze. If those backstops are deployed early, the left-side spike is smaller and shorter than history implies, which matters for anyone sizing a hedge on 2008 magnitudes.
The lesson: treat the smile as two conditional relationships, each with a test. A dollar rising with yields confirms the right side. A dollar rising while yields fall confirms the left side. A dollar falling while yields rise means neither model is in control.
Reading the current position on the curve
As of October 6, 2026, the 10-year Treasury yield stands at 5.27% and the 2-year at 4.79%, a 2s10s spread of +0.48%. The 2s10s spread is the 10-year yield minus the 2-year yield, and a positive reading means the curve slopes upward. A 10-year above 5% with the long end leading the short end is the pattern that splits the smile in two directions at once.
If the steepening reflects US growth running ahead of peers, this is right-side territory and the dollar should be firm alongside yields. If it reflects term premium, the extra compensation investors demand for holding long-dated debt amid fiscal or inflation uncertainty, then it echoes the 2025 break, and a high yield is not a dollar support. The yield level alone does not settle which reading is correct; the co-movement of the dollar and the 10-year does.

The practical rule follows directly. Track the rolling relationship between the dollar and the 10-year yield rather than either series alone. When they rise together, respect the right side and avoid fighting the carry. When the dollar rises while yields fall, expect funding stress to spread to emerging-market debt and commodities before it shows up in US equities. When yields rise and the dollar falls, recognize that the smile has stopped describing the market and size any dollar view accordingly.
The dollar smile, in one sentence: the currency strengthens through return-chasing flows when the US outperforms and through forced dollar buying when the world deleverages, and it weakens only when neither force is active. Every dollar view is therefore a view on which tail you occupy, and the cost of misjudging that is paid in the markets that owe dollars.