In February 2018 a cluster of funds and exchange-traded products that had spent two years selling volatility discovered what quadratic losses feel like....
The trade that broke the "1x3" sellers
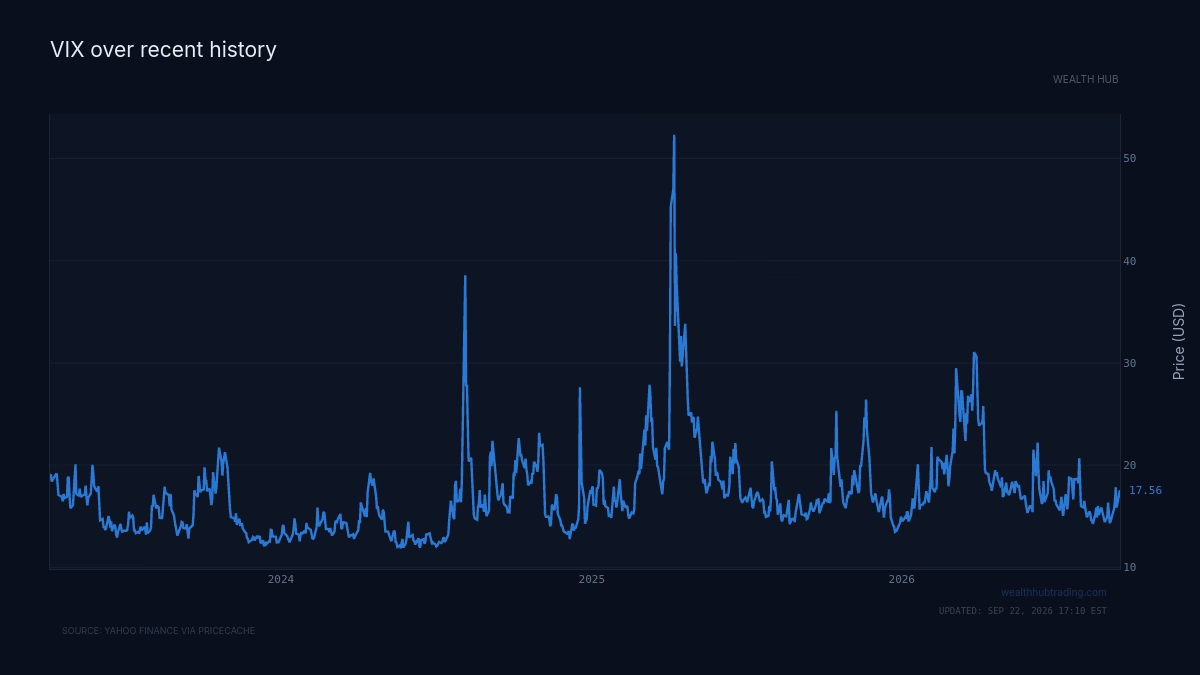
In February 2018 a cluster of funds and exchange-traded products that had spent two years selling volatility discovered what quadratic losses feel like. The VIX, which measures the market's expected 30-day volatility on the S&P 500, sat below 12 for most of 2017. Selling volatility during that stretch was among the most reliable income trades on the desk. Then on February 5, 2018, the VIX more than doubled in a single session, closing near 37 from the mid-teens. One popular inverse-volatility product lost roughly 90% of its value overnight and was liquidated within days.
The people running those trades were not reckless in an obvious way. Most had risk limits, stop-losses, and years of positive returns. What they underestimated was the shape of the payoff. A short-volatility position does not lose money in proportion to the size of the move. It loses money in proportion to the square of the move. That single fact is the whole story, and it is easiest to see through the two instruments built specifically to trade volatility itself: the variance swap and the volatility swap.
What these swaps actually pay
A volatility swap is a contract whose payoff is the difference between realized volatility over some period and a fixed number agreed at the start, called the strike. If you buy a one-month volatility swap struck at 15 and realized volatility comes in at 20, you receive five volatility points times a dollar amount per point, called the vega notional. The relationship is linear: every extra point of realized volatility pays the same fixed amount.
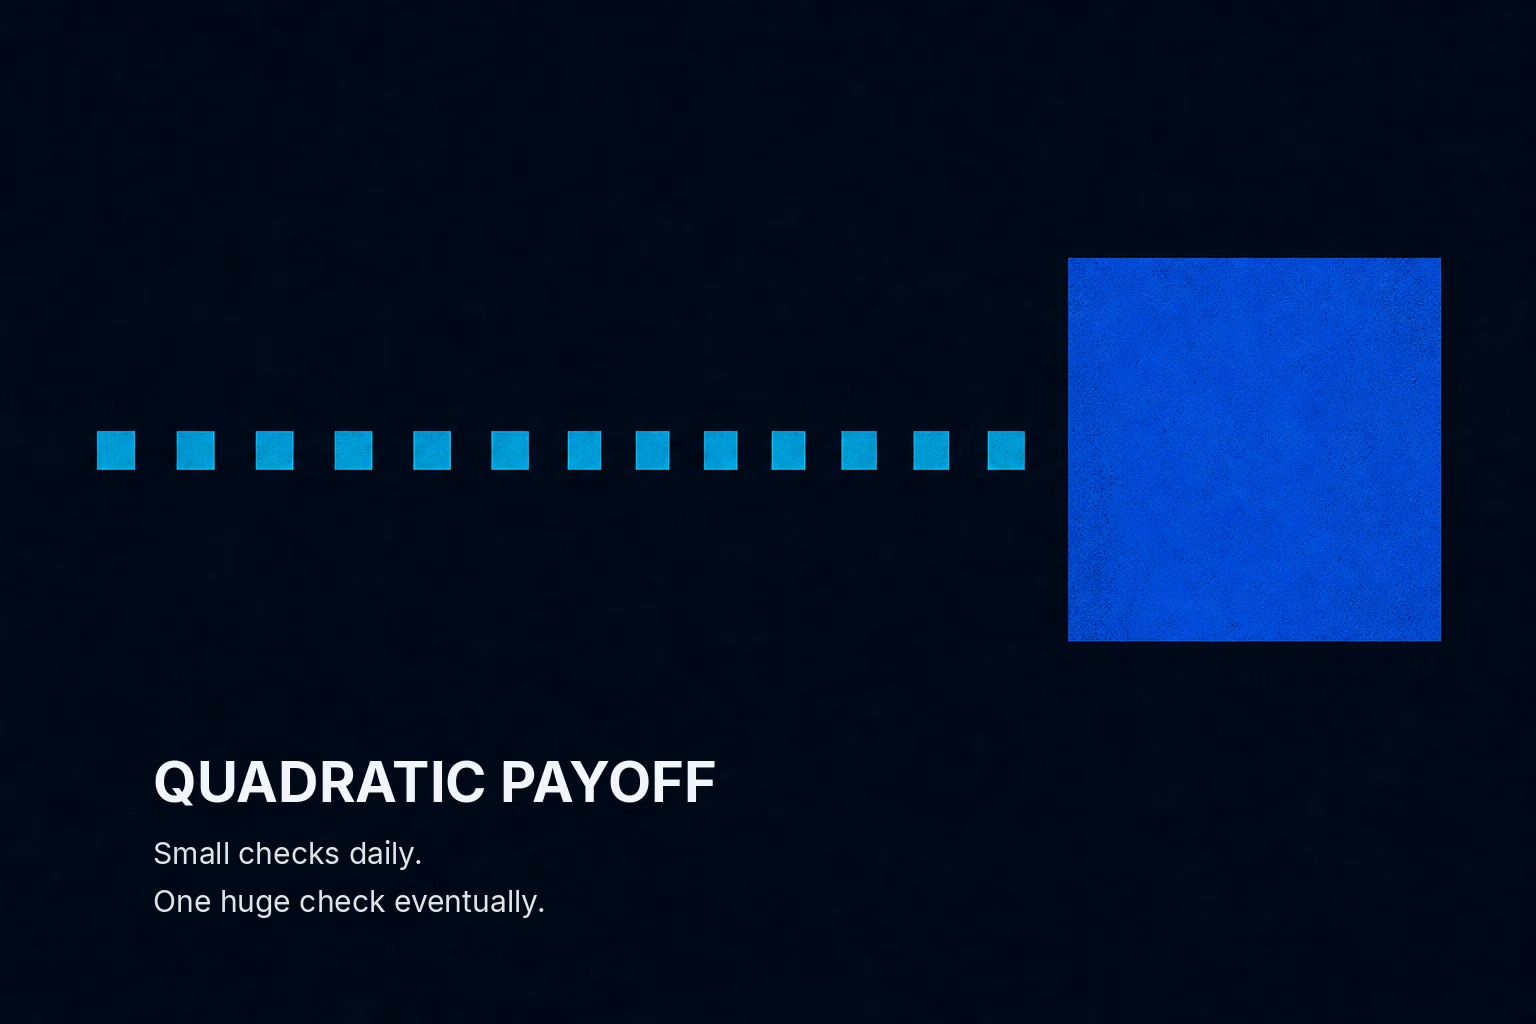
A variance swap looks similar but pays on variance, which is volatility squared. Its payoff is realized variance minus strike variance, again times a notional. Because variance is the square of volatility, the payoff curves. Realized volatility of 20 against a strike of 15 does not pay five units of anything. It pays the difference between 20 squared and 15 squared, which is 400 minus 225, or 175, scaled by the notional. Move realized volatility to 30 and the payoff jumps to 900 minus 225, or 675. The move in volatility doubled from a 5-point miss to a 15-point miss; the variance payoff grew almost fourfold.
The practical implication for anyone reading a term sheet: the word "variance" is not a technicality. It tells you the loss function bends. On a volatility swap your worst day scales with the move. On a variance swap your worst day scales with the move squared.
Why the seller looks so smart for so long
Volatility is mean-reverting and, on average, realized volatility comes in below the level implied by options prices. That gap, the difference between what options buyers pay for protection and what actually gets delivered, is the variance risk premium. Someone has to be paid to hold the risk that markets suddenly get violent, and that someone is the variance seller. In calm periods the premium is pure carry: sell the strike, watch realized volatility print lower, collect the difference.
This is why the trade feels like income rather than speculation. The seller of a variance swap struck at 15 wins every month realized volatility stays under 15, which in a bull market is most months. Returns look smooth, the Sharpe ratio looks excellent, and the drawdowns look small right up until they do not.
The mechanism that produces the smoothness is the same one that produces the eventual disaster. Because the payoff is quadratic, the seller barely notices a move from 12 to 15. The loss is 225 minus 144, or 81 units. But a move from 12 to 40, the kind of move that arrives once every few years, costs 1,600 minus 144, or 1,456 units. The second move is roughly three times larger than the first in volatility terms and roughly eighteen times larger in variance terms. Years of 81-unit gains are erased by one 1,456-unit loss.
What this means for you: when you see a strategy with a long, quiet track record and a payoff described in variance rather than volatility, the track record is not evidence of safety. It is evidence that the one bad day has not happened yet.
The flow that turns a shock into a cascade
The February 2018 episode was not only a story about the shape of a payoff. It was a story about who was forced to trade when the payoff turned. This is the part consensus commentary usually skips, because it reads the price and not the positioning underneath it.
The dealers and funds short variance and volatility are, in aggregate, short gamma. Gamma is the rate at which an option position's directional exposure changes as the underlying moves. A short-gamma book gets longer as the market falls and shorter as it rises, which means to stay hedged the holder must sell into declines and buy into rallies. Their hedging amplifies whatever the market is already doing.
When the VIX doubled on February 5, the inverse-volatility products had to buy VIX futures to cover their exploding short, and they had to do it near the close, in size, into a market that had already moved. That mechanical buying pushed VIX futures higher still, which deepened the losses on every other short-volatility book, which forced more covering. The move fed itself. This is the difference between a position that loses money and a position that is forced to liquidate: the second one moves the price against itself on the way out.
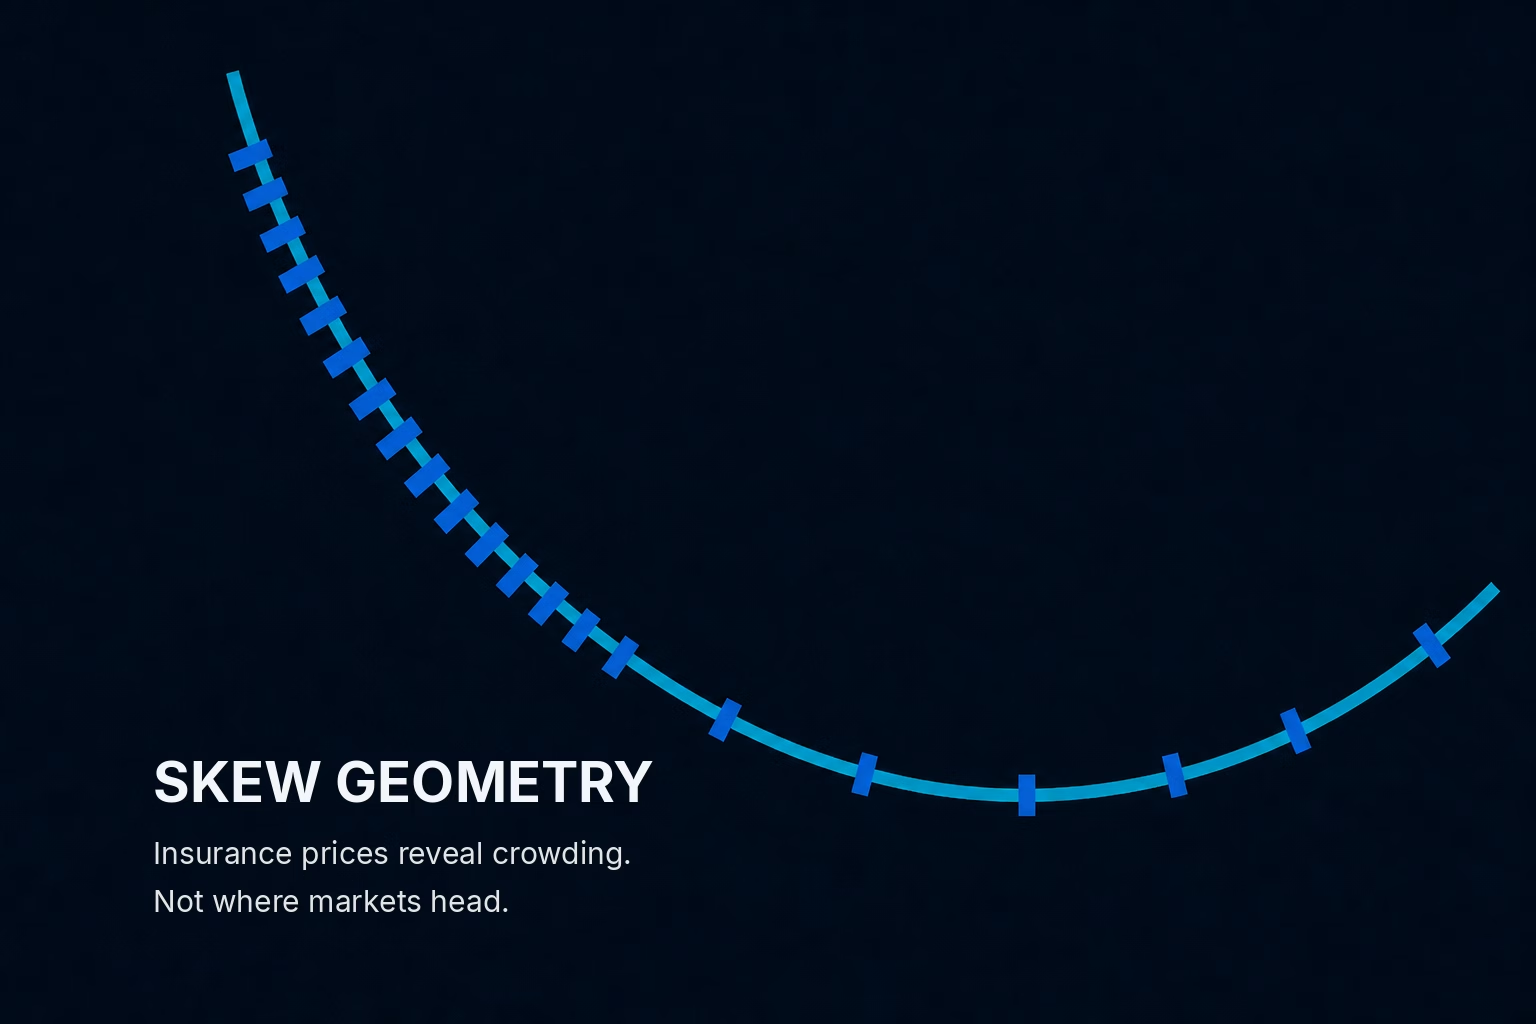
The practical takeaway is that the size and concentration of short-volatility positioning is a better early-warning indicator than the level of the VIX. A low VIX with crowded short-gamma positioning underneath it is not calm. It is a spring under compression, and the flow that releases it is forced hedging, not fresh selling.
Where the two swaps diverge, and why it matters
The choice between a variance swap and a volatility swap is a choice about tail exposure. A variance swap seller is more exposed to a single violent spike because the squared payoff punishes extremes disproportionately. A volatility swap seller takes the same directional view with a gentler loss curve, but pays for that gentleness: volatility swaps are harder to hedge and price, because they cannot be replicated cleanly with a static portfolio of options the way variance swaps can.
That replication point is the reason variance swaps dominate the market despite the uglier tail. A variance swap can be manufactured from a strip of options across strikes, which lets a dealer quote it and hedge it with known instruments. A volatility swap requires the dealer to manage a position whose sensitivity to volatility changes over time, which is why they trade less and cost more to unwind.
The mechanism breaks in exactly the case that matters most. The static-option replication of a variance swap assumes the underlying moves continuously, without jumps. When the market gaps, a Monday open far from Friday's close, the replicating portfolio no longer tracks the swap, and the dealer's hedge fails at the worst possible moment. Every large volatility event, from 1987 to 2018, is a jump event. The instrument that is easiest to hedge in calm markets is the one whose hedge fails in the crash.
For a reader deciding whether to hold either side of these contracts, the distinction is concrete: buy variance when you want convex protection against a violent, gapping move and are willing to pay the premium every quiet month. Sell it only if you can size the position for the 1,456-unit day, not the 81-unit day.
The one sentence to remember
A variance swap pays the square of the move, so its seller earns linear-looking income and carries squared-looking risk; the danger is not the average day but the single gap that arrives with forced hedging behind it, and that is why steady carry can convert to a margin call in one session.