discover
Two outsiders from Berkeley turned a small $110,000 account into millions by spotting what Wall Street missed that markets often misprice uncertainty.
7
min read
Discover how elite investors use Section 351 ETF conversions to move billions without triggering capital gains taxes a legal loophole reshaping modern portfolios.
6
Seasonal trading isn’t just market folklore it’s grounded in decades of recurring patterns influenced by investor behavior, macroeconomic cycles, and calendar-based events. If you understand the rhythms of the market, you can align your trades with high-probability windows that give you an edge.
8
A deep dive into the 1929 stock market crash, examining the economic factors, investor behavior, and lasting consequences that reshaped financial markets for decades.
17
From card counting and roulette arbitrage to hedge funds and crisis-era trades, this article examines how Ed Thorp systematically exploited edge, risk asymmetry, and market dislocations across decades.
12
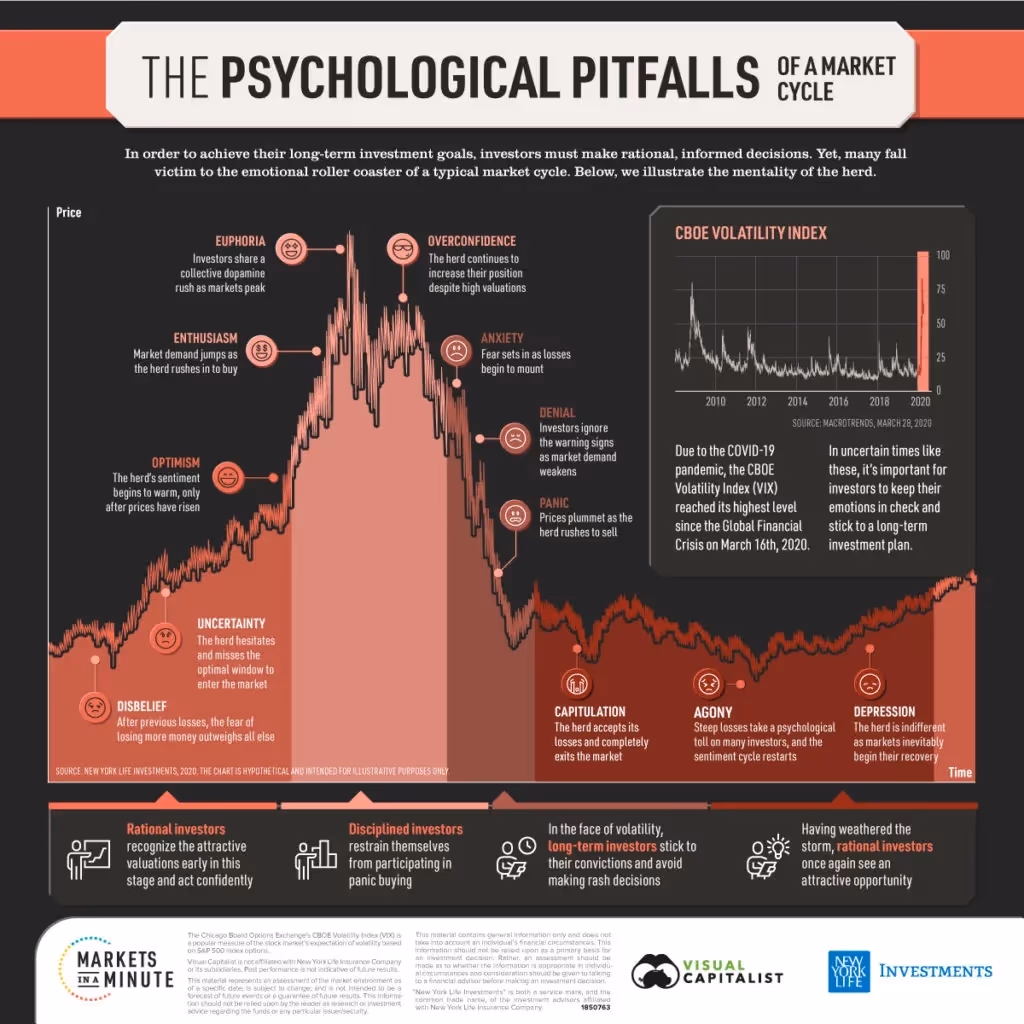
Track fear and greed in the markets with this multi-factor index to make smarter trading decisions in volatile times.
5
Post-hike market moves are unpredictable history offers clues, not certainties, for investors navigating interest rate cycles.
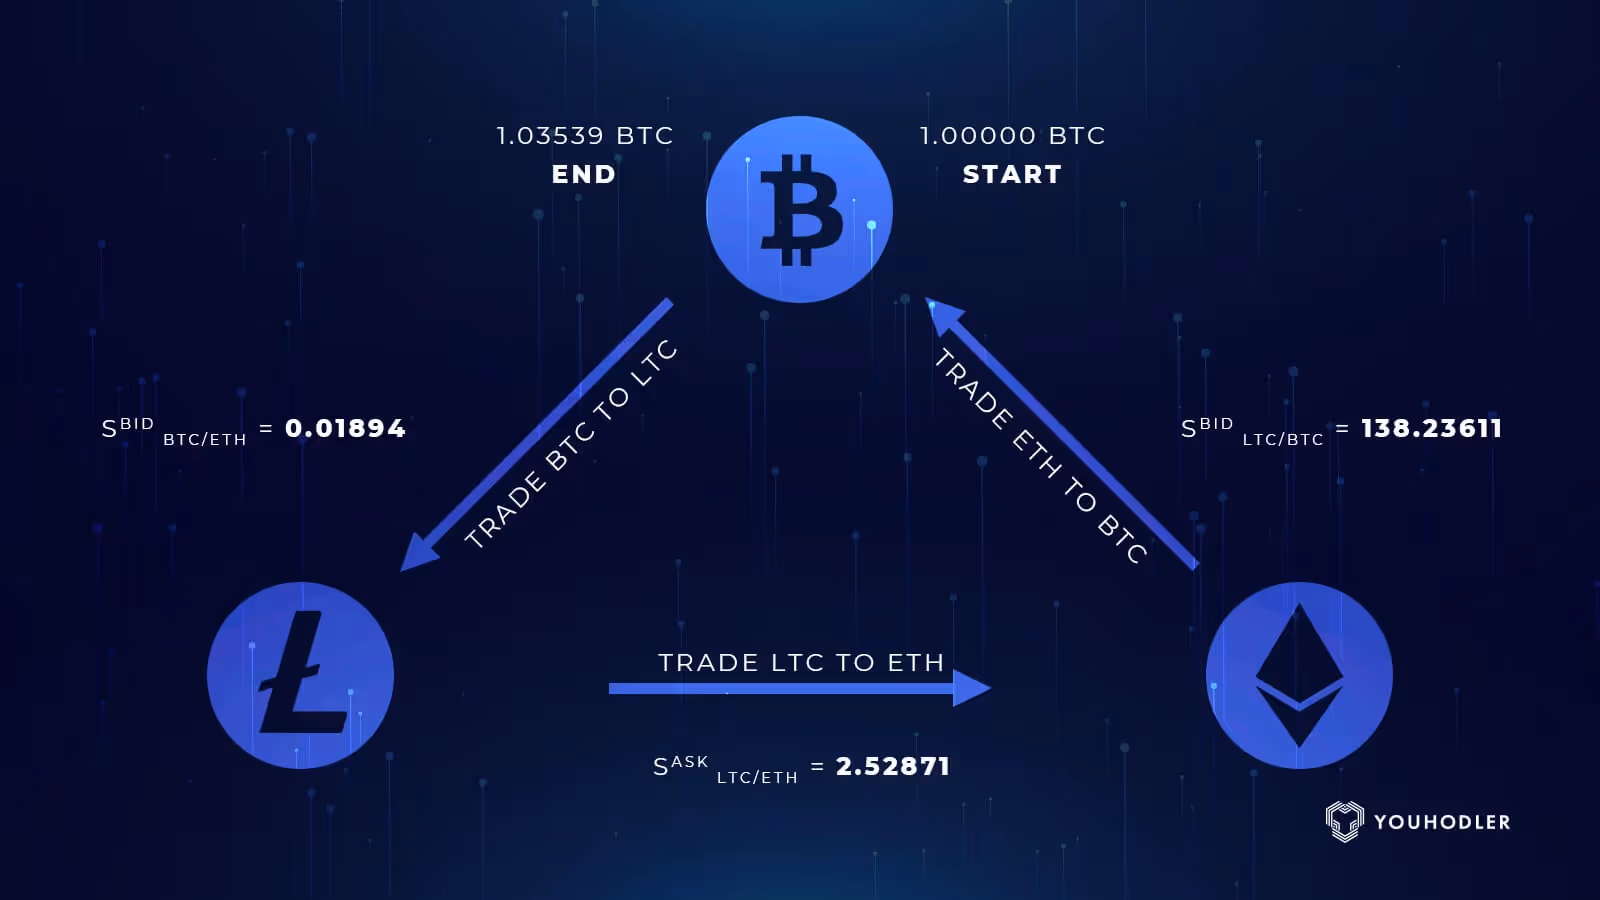
Discover how crypto arbitrage works, why true low-risk opportunities are rare, and what separates successful traders from the crowd.
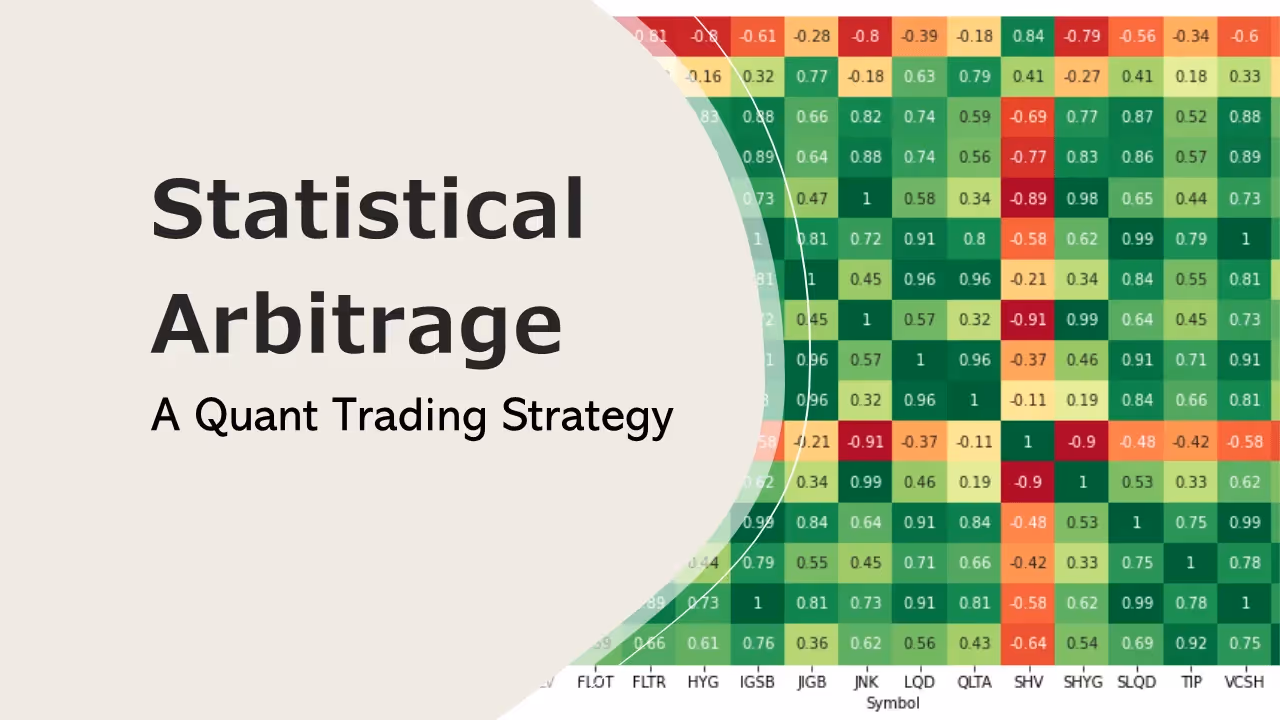
Learn how cointegration uncover lucrative trades, with Python examples.
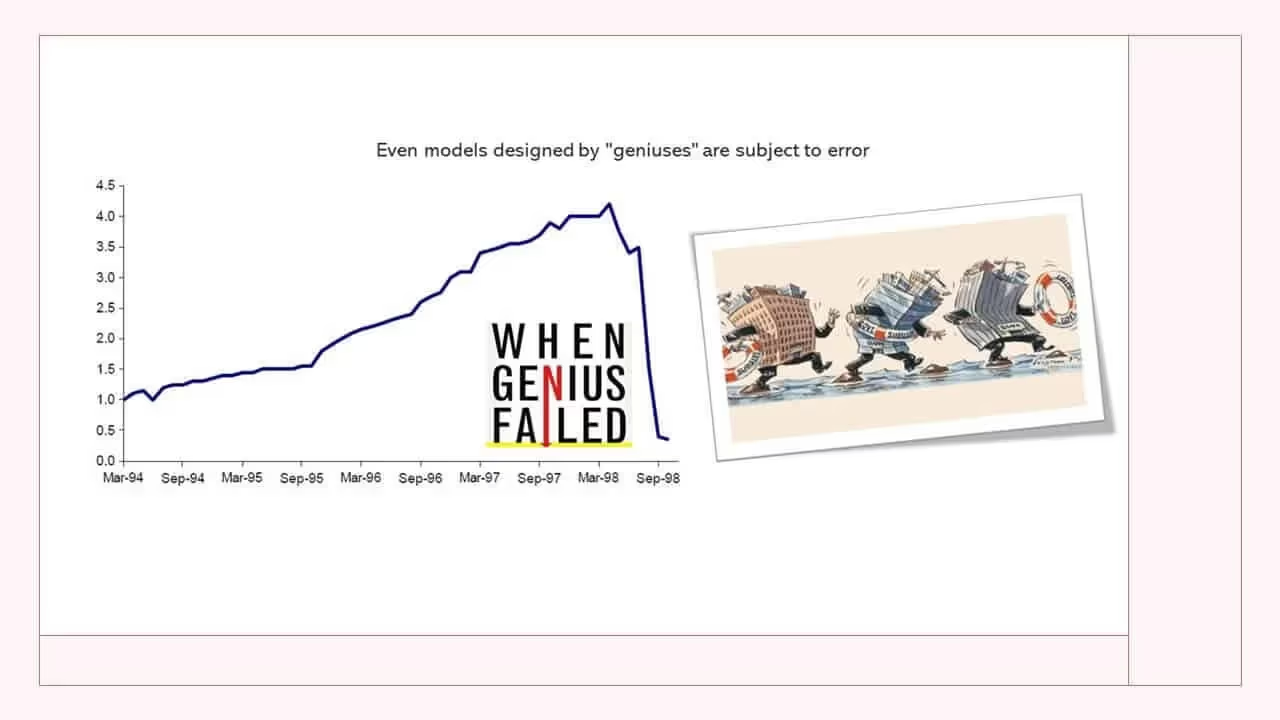
Explore the LTCM collapse and what it teaches about high leverage & risk management.
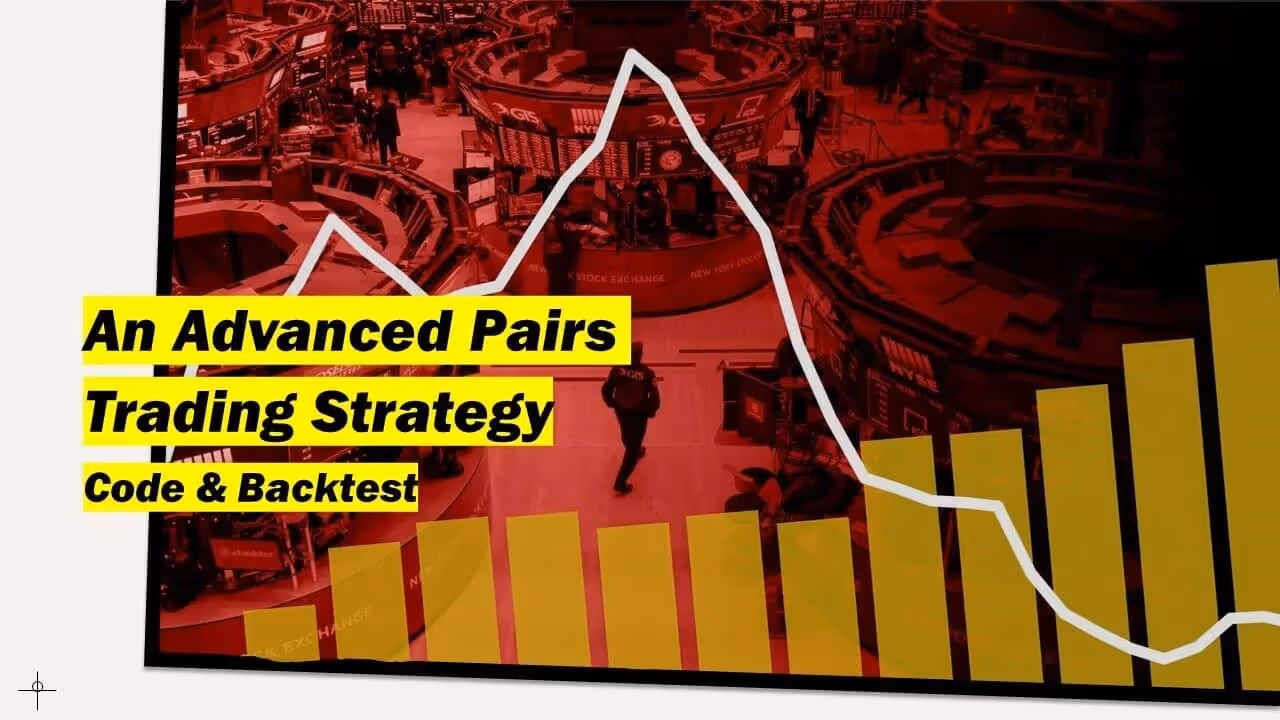
Inside a backtested pairs trading system logic, results, and code revealed.
A trader’s guide to probabilistic neural networks and market uncertainty.
22
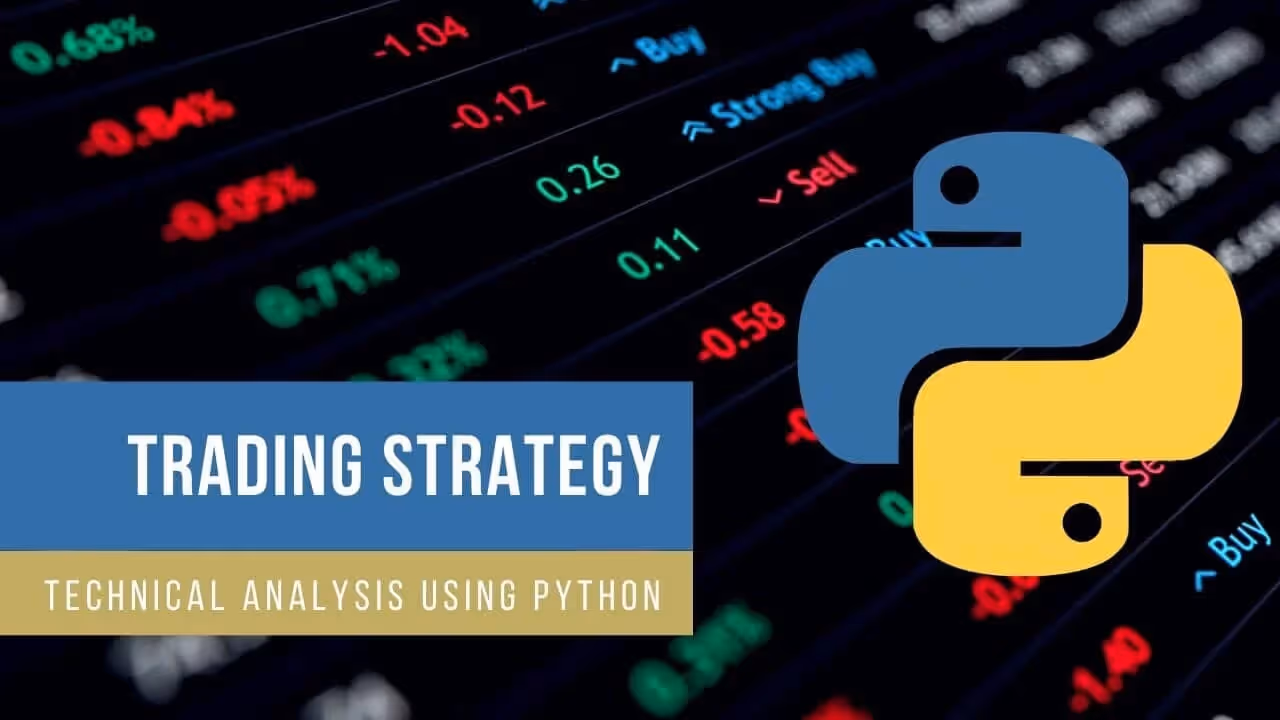
Bitcoin Price Prediction with Python and Technical Indicators.
Was Jesse Livermore right when he said, “I learned early that there is nothing new in Wall Street. There can’t be because speculation is as old as the hills. Whatever happens in the stock market today has happened before and will happen again.”
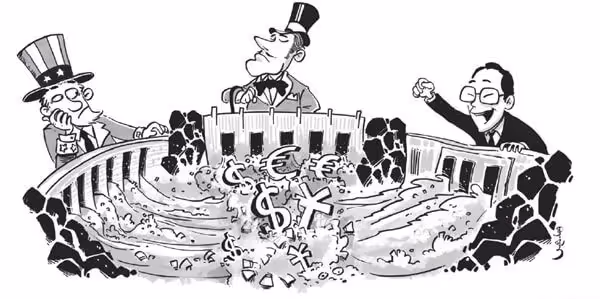
Exchange rate fluctuations influence economic activity not only via the standard trade channel, but also through a financial channel, which operates through the impact of exchange rate fluctuations on borrowers’ balance sheets and lenders’ risk-taking capacity. The paper explores the “triangular” relationship between (i) the strength of the US dollar, (ii) cross-border bank flows and (iii) real investment.
1
practical guide to key SEC filings, highlighting the forms traders and investors should monitor to spot market-moving information.
13
Securities class action filings for February - Under Armour, FXCM Inc, Psychemedics Corporation, Stemline Therapeutics, DaVita Inc, Neustar, Roadrunner Transportation Systems.
Discover how to use COT commercial short data to anticipate commodity price moves and gain an edge by following the market’s smartest players.
4
The commercial net positions are a mirror of the large trader net positions. Most of the time commercial net positions mirror the funds trading patterns but there are some important exceptions to this rule.
2
The COT Report is the single most important report issued by the CFTC revealing internal market dynamics.
We want to fill a gap here. A lot of economic data is published day in and day out but yet most of us don’t really understand the lingo behind it. Let’s bring some clarity into this. Regularly we come across certain terms dealing with measures of economic activity. Most of them are pretty straight forward if you give it a chance. So let’s proceed with some of the more common concepts you will run across when analyzing economic indicators.
On October 13th, 2016 WINS Finance Holdings (WINS) closed at $25.22. On March 09th 2017, the obscure Chinese financial company, headquartered in New York, trades at $315. Yes $315. That is not a typo. Up +1200%. The high was on February 8th, 2017 WINS closed at $452.
A company’s 10 Q report is one of the most important tools an investor has to decide if and when a particular stock is a buy/short opportunity.
Ben Graham, the father of value investing, once said of the stock market, “In the short run, the market is a voting machine but in the long run it is a weighing machine.” To Graham the market was like a popularity contest. Investors “vote” for a stock out of considered enthusiasm for its prospects. Results however are determined in the long run as profits are “weighed” year after year and intrinsic value is revealed.
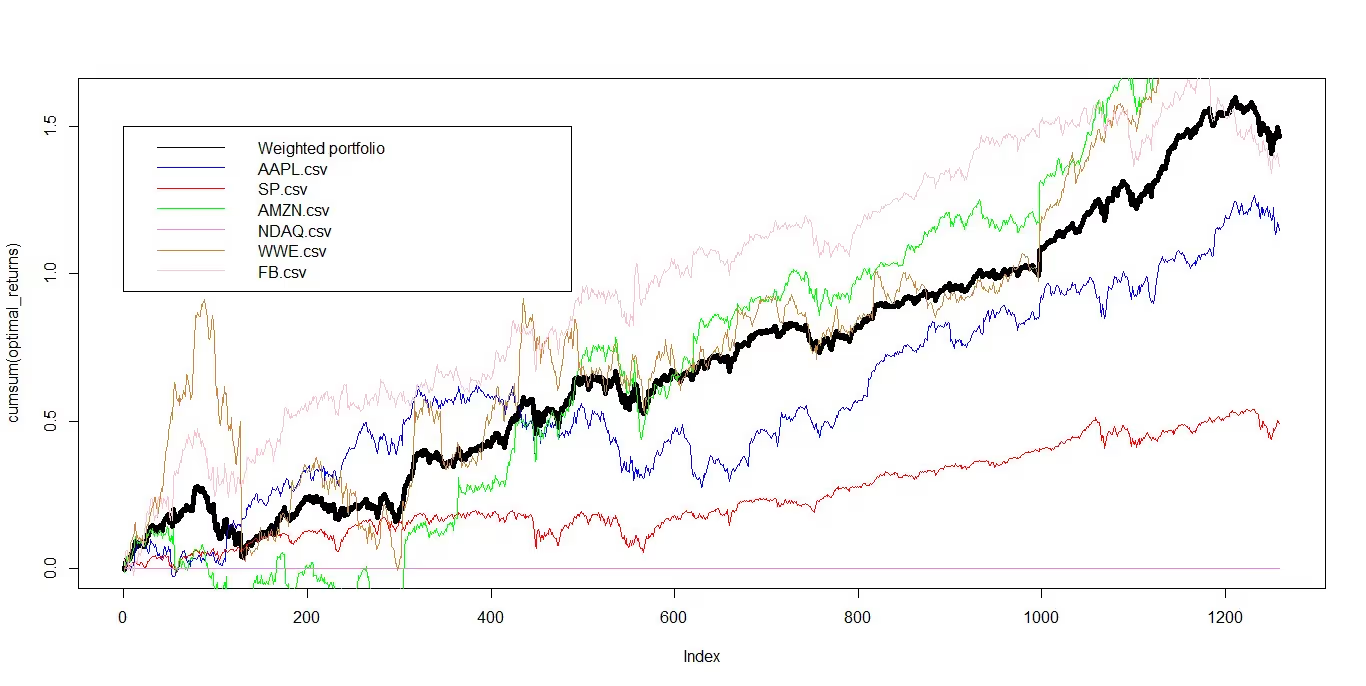
Optimize and backtest mean-variance & CVaR portfolios with real-world examples in R.
29
The purpose of portfolio optimization is to minimize risk while maximizing the returns of a portfolio of assets.
Bollinger Bands reveal market volatility and trend shifts, but using them alone can be misleading learn how to trade smarter with proper risk and filters.
Learn how mean reversion systems spot extreme price moves and structure trades around the market’s natural tendency to return to its average.
Read Next 10 Key Points in a Companies 10Q Report In this article we will look at the futures market and how statistical analysis can pave the way for better trading results. What makes the statistical analysis we are going to show you even more important is the fact that you are going to learn how to increase the odds of your trading success in a simple but effective way.
When it comes to trading there is a common belief that most behavior in markets can be explained by assuming that market participants make ‘logical’ trading decisions. In reality we know it’s not that easy. However there are market movements that are predictable because they repeat every year. We call this seasonal movement. You don’t have to be a math wizard to see seasonal cyclic movements in assets repeating year over year. To be able to predict the movement of a particular market it’s useful to analyze the seasonal pattern over a certain time period that should usually range from 10 to 15 years.
3
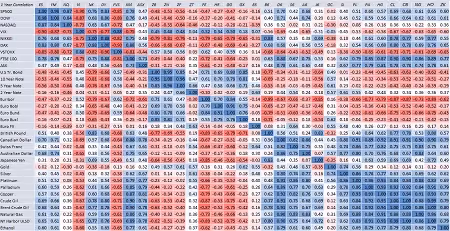
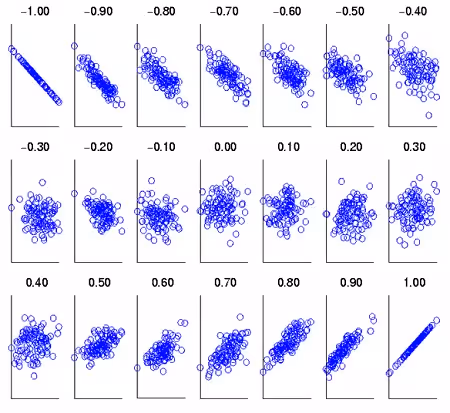
Inter-Market Correlations for the major futures markets including time intervals of 1 Year - 6 Months - 3 Months - 1 Month
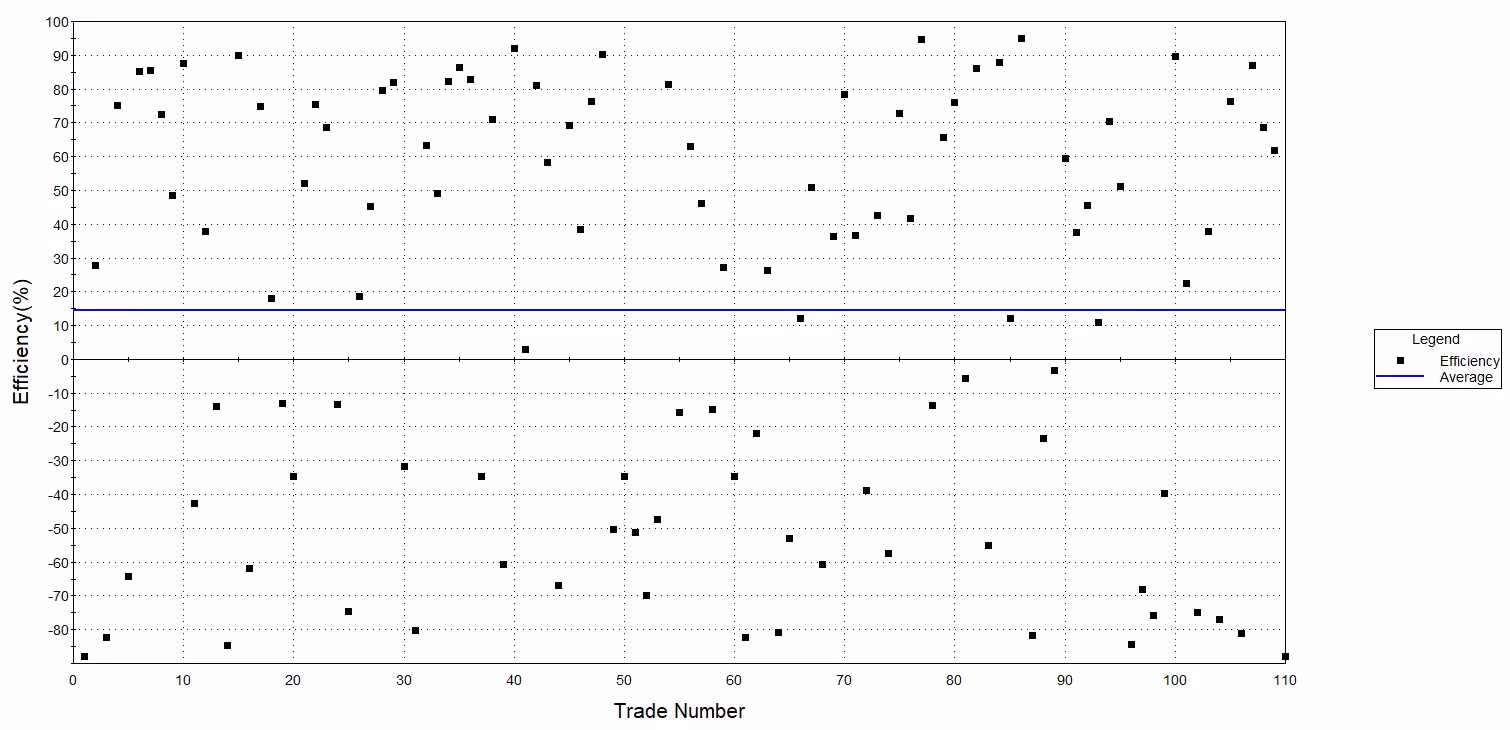
Money management implementations should be monitored on a periodic basis if you want to maintain your exposure. Two aspects of your trading system should be monitored one is your risk and the other one is the volatility.
Discover how traders use ATR and daily volatility to calculate optimal position sizes, keeping risk in check while capturing market moves.
Read Next Volatility Risk Management Volatiltiy Method If one thing can be called the holy grail of trading or at least come close to it then its money management. Some people call it diversification while others call it how to wisely invest your hard-earned dollar.In simple words money management is the rule book that tells you how much of your money you should put at risk for a particular trade.
Using Python to visualize price data and spot potential market turning points.
9
Discover why the golden cross outperforms the death cross in long-term market trends, backed by decades of Dow Jones data and robust backtesting.
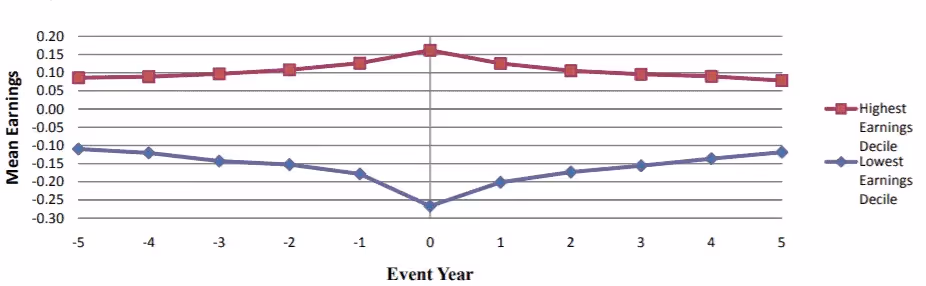
Unlock hidden market opportunities with the accrual anomaly: learn how savvy investors exploit balance sheet quirks to spot mispriced stocks and boost returns.
11
Ever wondered if you can design a profitable trading strategy by trading volatility ETFs ? Well, yes you can. Those ETFs are highly ineffective vehicles on a long term investment horizon. However short term strategies have shown to be a rewarding way to trade these ETFs.
Time frames are used in order to forecast future price trends. Many traders are missing out on this important aspect of trading by only looking at one time frame when trying to define a trend. Therefore its important to categorize trends as primary, intermediate and short-term trends.
The trend following model by Kaufman says that trading by the direction of the trend is a conservative approach to the markets.
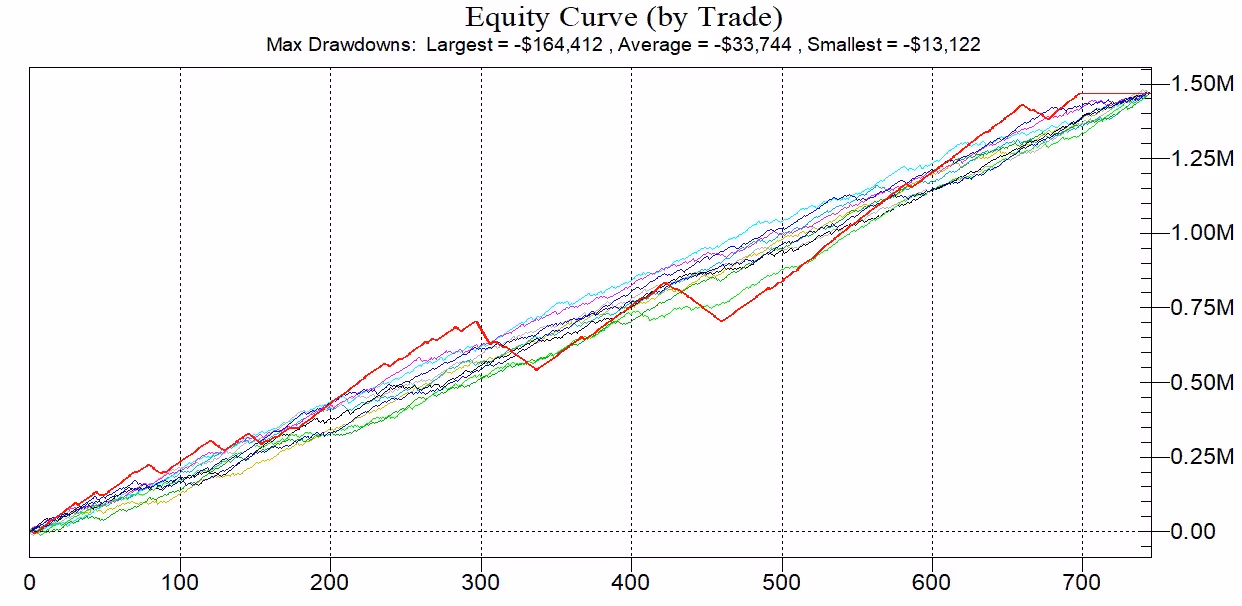
The walk-forward analysis is the most crucial building block of your trading strategy. At this stage it is determined if the hypothetical returns are a result of overfitting or the result of a robust trading system. If the walk-forward analysis produces negative results you must go back to the first step of your strategy development process. The analysis answers three essential questions: is the trading system profitable, what is it the profit factor to be expected in real time trading and how will changes in market conditions affect my strategy performance.
33
This article breaks down how experienced traders recognize range-bound formations, quantify mean reversion, and manage risk when markets oscillate instead of trend.
Build smarter trading strategies using event-driven price patterns and statistical analysis.
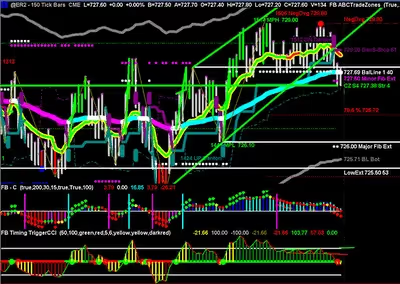
The goal of this research is to find various set-ups and exit strategies that could be used for trading the opening range breakouts. The time frames we will be looking at are 10min, 15min and 30min opening range breakouts. We will focus our attention on the very liquid futures markets in particular we will analyze the S&P500 futures. We would like to encourage you as the reader to participate in the discussion and share your knowledge and/or ideas about opening range trading systems.
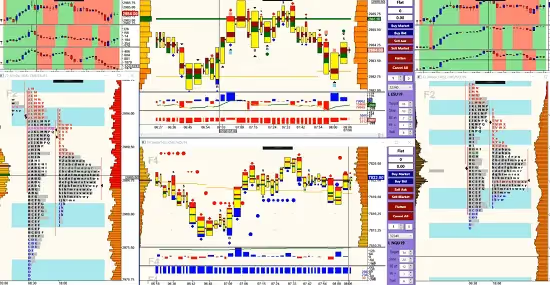
Today we gonna show you something really interesting and when done correctly it can be exploited. We are talking about imbalances. You can basically do this with any time frame and any contract especially those with rising volatility and severe directional price changes for a prolonged period of time.
While Indiana Jones might have found it safely tucked away in the Temple of the Sun, to legendary investor Ray Dalio, the "Holy Grail" is a sweet spot between diversification and correlation.
The concept of diversification is based on the concept that a trader can reduce his risk exposure by entering several positions at the same time. The success of a traders portfolio is therefore based on reducing risk rather than maximizing returns.
The Spider’s Web: Britain’s Second Empire, is a documentary, which shows how Britain transformed from a colonial power into a global financial power.
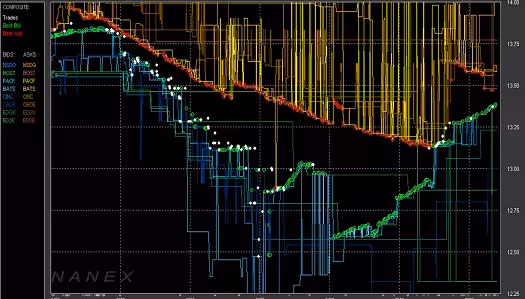
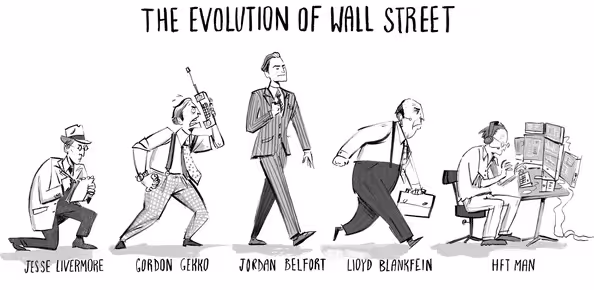
A thrilling documentary about a genius algorithm builder who dared to stand up against Wall Street. Haim Bodek aka The Algo Arms Dealer. Haim Bodek is a former Goldman and UBS trader who has come firmly out against how stock exchanges work with high frequency traders. Mr. Bodek had worked with rapid-fire trading firms to give them an unfair edge over everyday investors. He became convinced exchanges were providing such an edge after he says he was offered one himself when he ran a high-speed trading firm—a way to place orders that can be filled ahead of others placed earlier. More information on the different order types can be found here.
Get notified about new articles every week!